













Define the funnels
Signup, activation and purchase funnels built from the steps that matter, with conversion windows and breakdowns by source, plan or device.


 4.9 / 5
PostHog product analytics that shows where users drop off, which ones stay and what your team should change next.
Selected work, in motion.
The experiences behind the journeys teams measure.The events are flowing. What is missing is a shared view of what they mean.
What's included
We build the views your team will open every week, and retire the ones nobody trusts.
Signup, activation and purchase funnels built from the steps that matter, with conversion windows and breakdowns by source, plan or device.
Active users, power users and at-risk accounts defined once in PostHog, then reused in insights, feature flags and experiments.
Each funnel drop paired with filtered session replays and heatmaps, so the number comes with a reason you can see.
A small set of dashboards per team, each answering a named question, with notes on how every metric is counted.
Security, by consideration.
For your PostHog project, we consider event collection, personal data, workspace access and ingestion endpoints as part of one connected build.
See our approachGitHub workflows, peer review and dependency checks bring decisions into the release process.
Certificate configuration, HTTPS and secure headers help protect the path between your users and your systems.
Scoped tool access, validated inputs and human approval where automated actions carry consequences.
Every dashboard starts with the decision it is meant to support.
Short sessions with product, growth and leadership to list the decisions data should inform.
Funnels, retention, cohorts and paths built in PostHog and checked against your source data.
We walk through what the data says and what to do about it, then hand over.
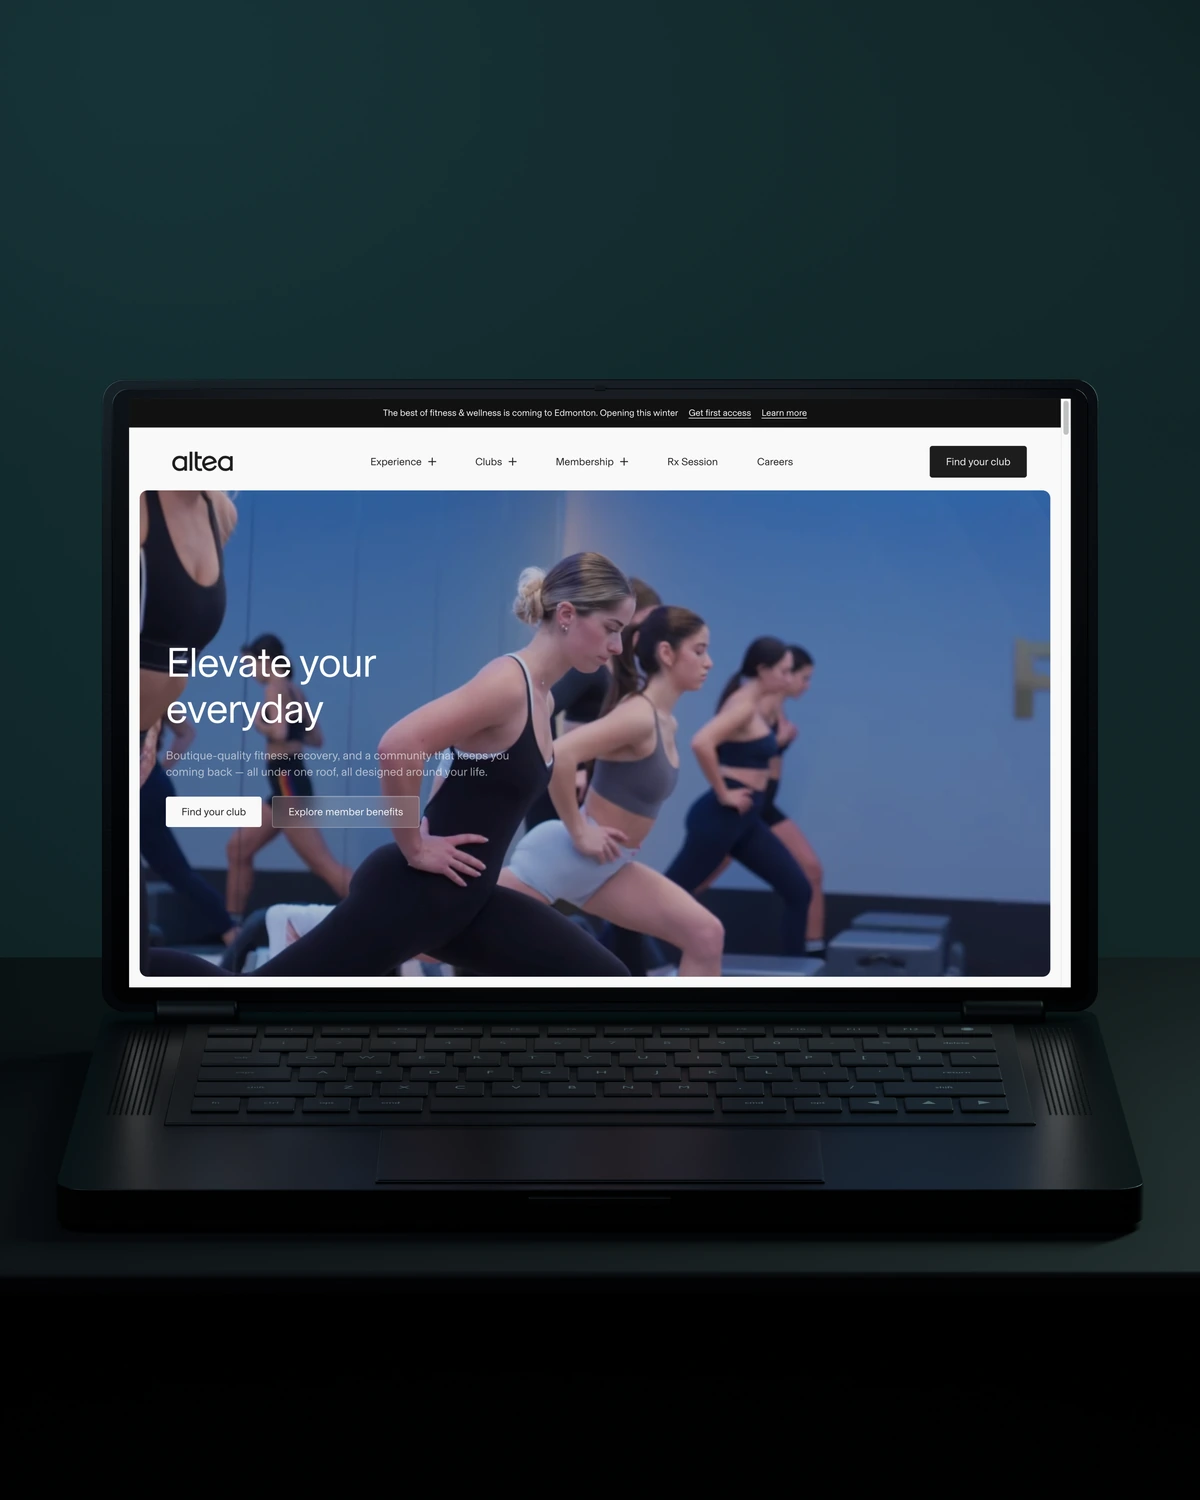


 Built to driveMore memberships.
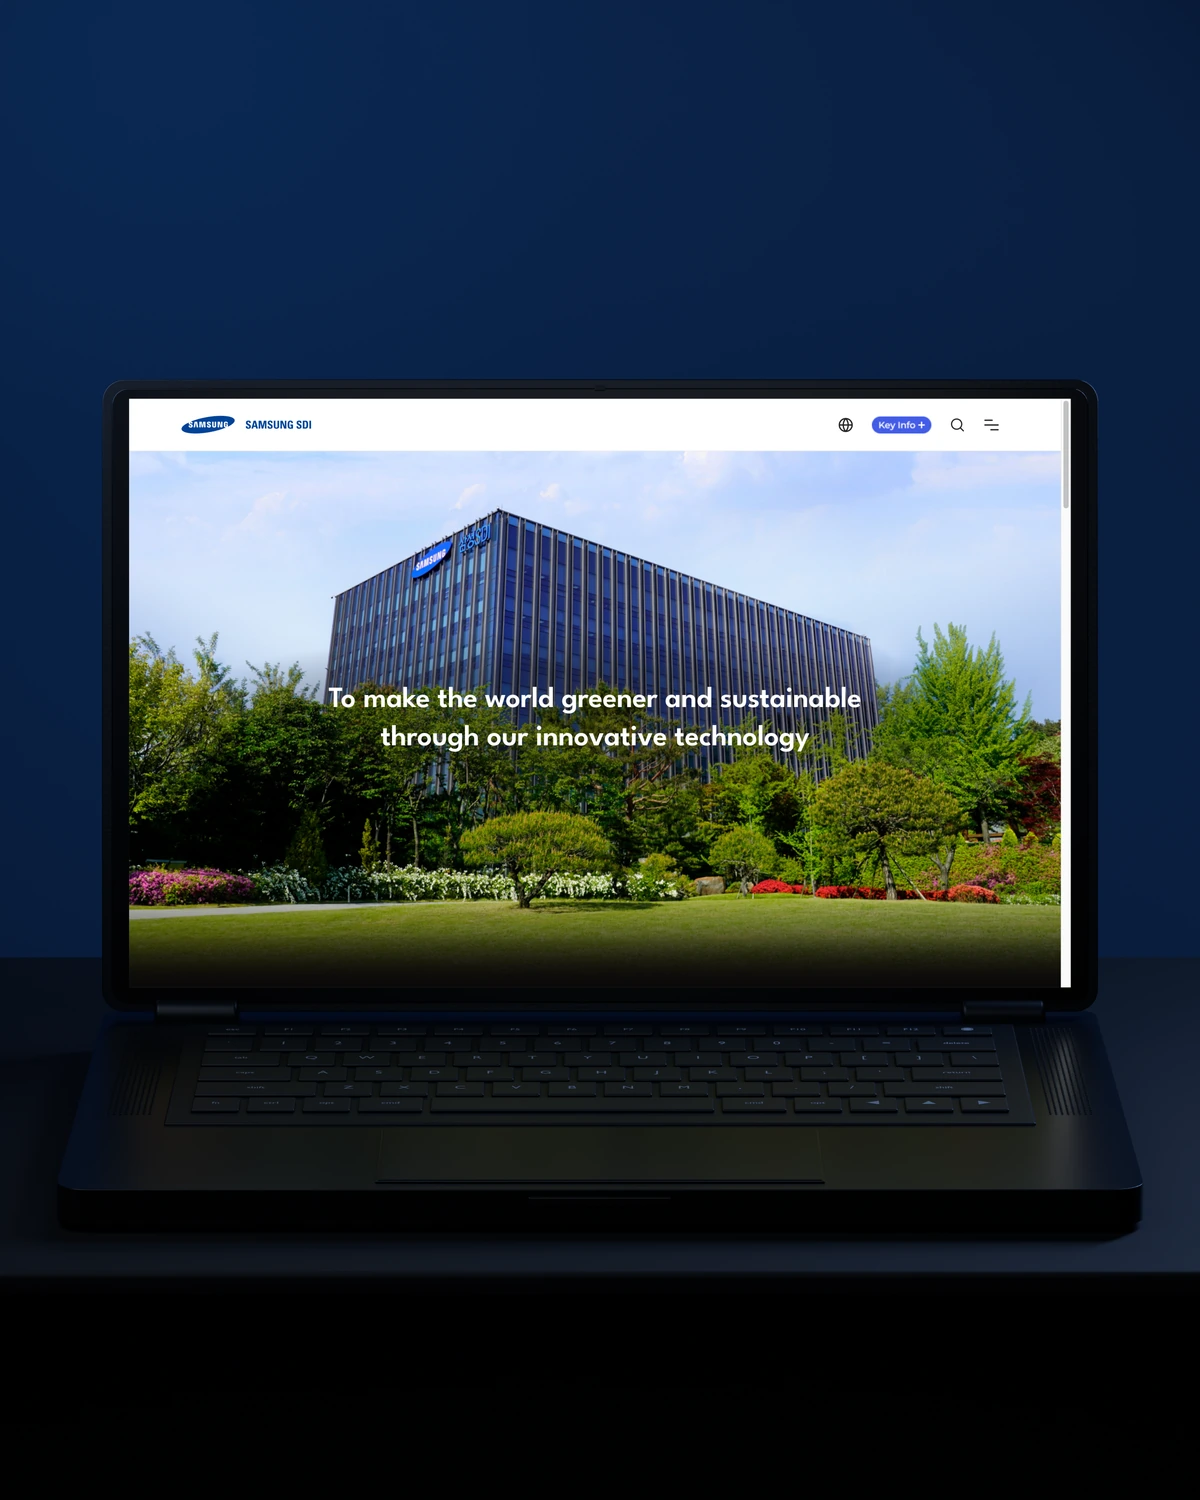

 Built to driveBetter-qualified leads.
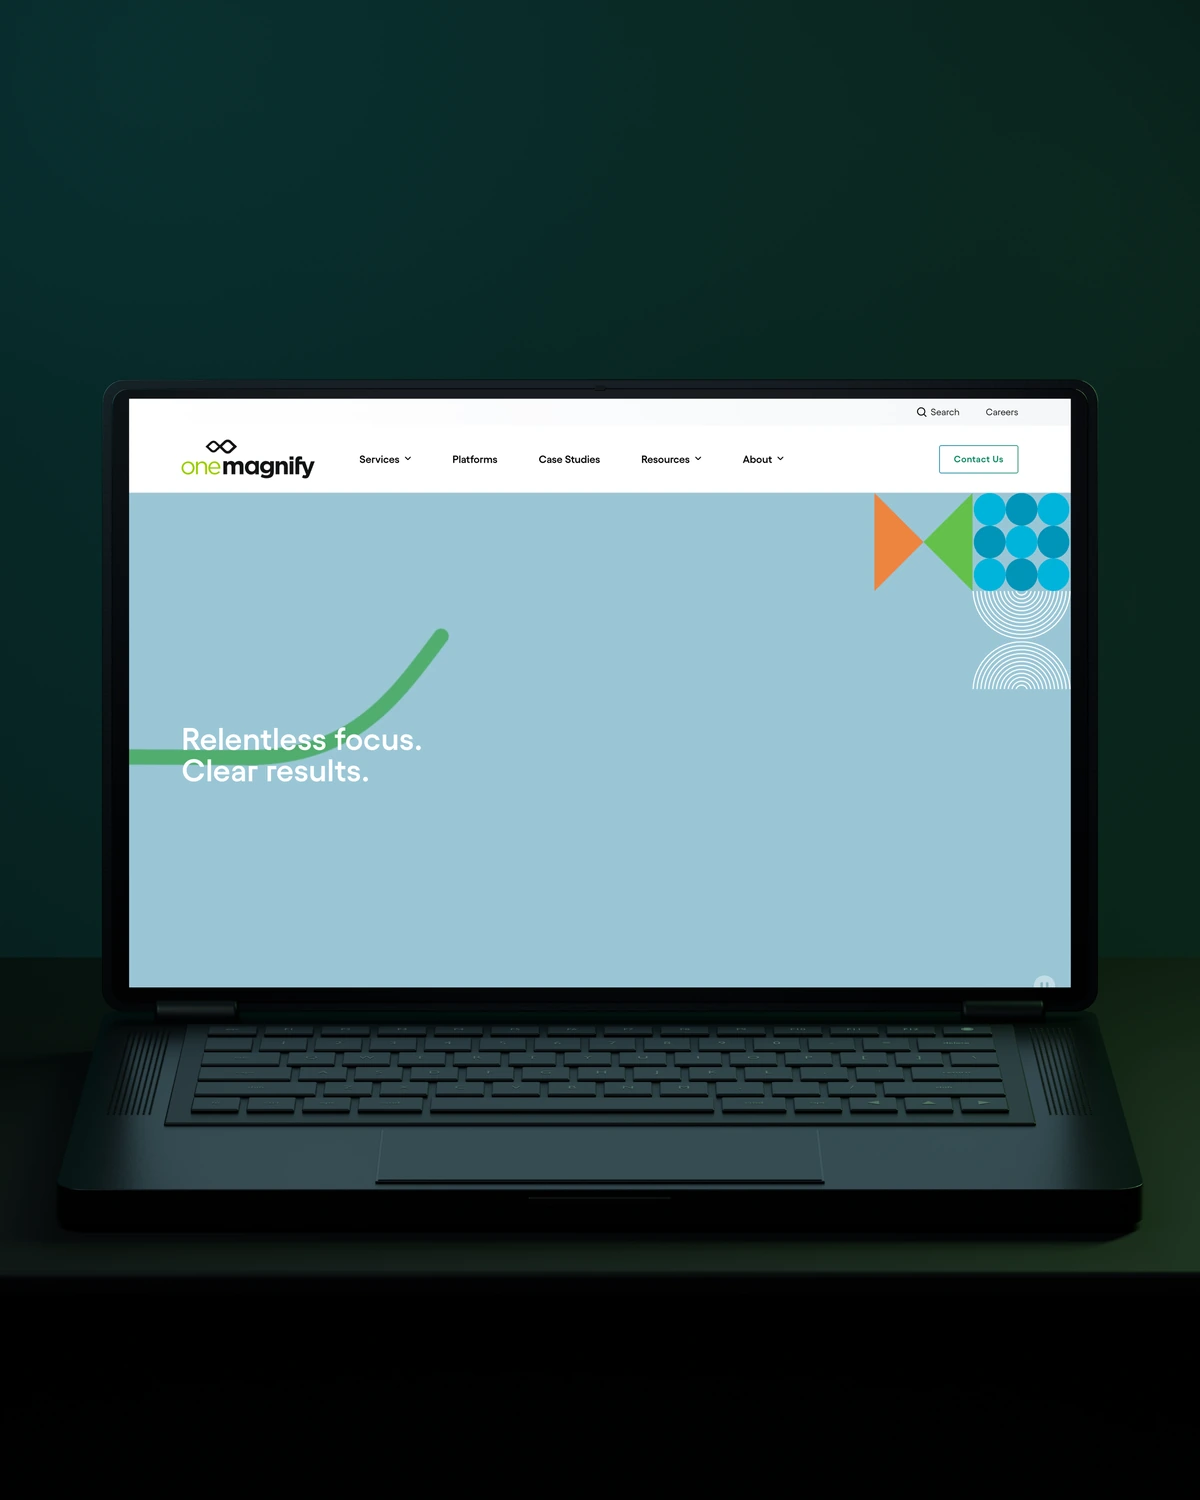
 Built to driveMore qualified candidates.



 Built to driveMore enquiries.
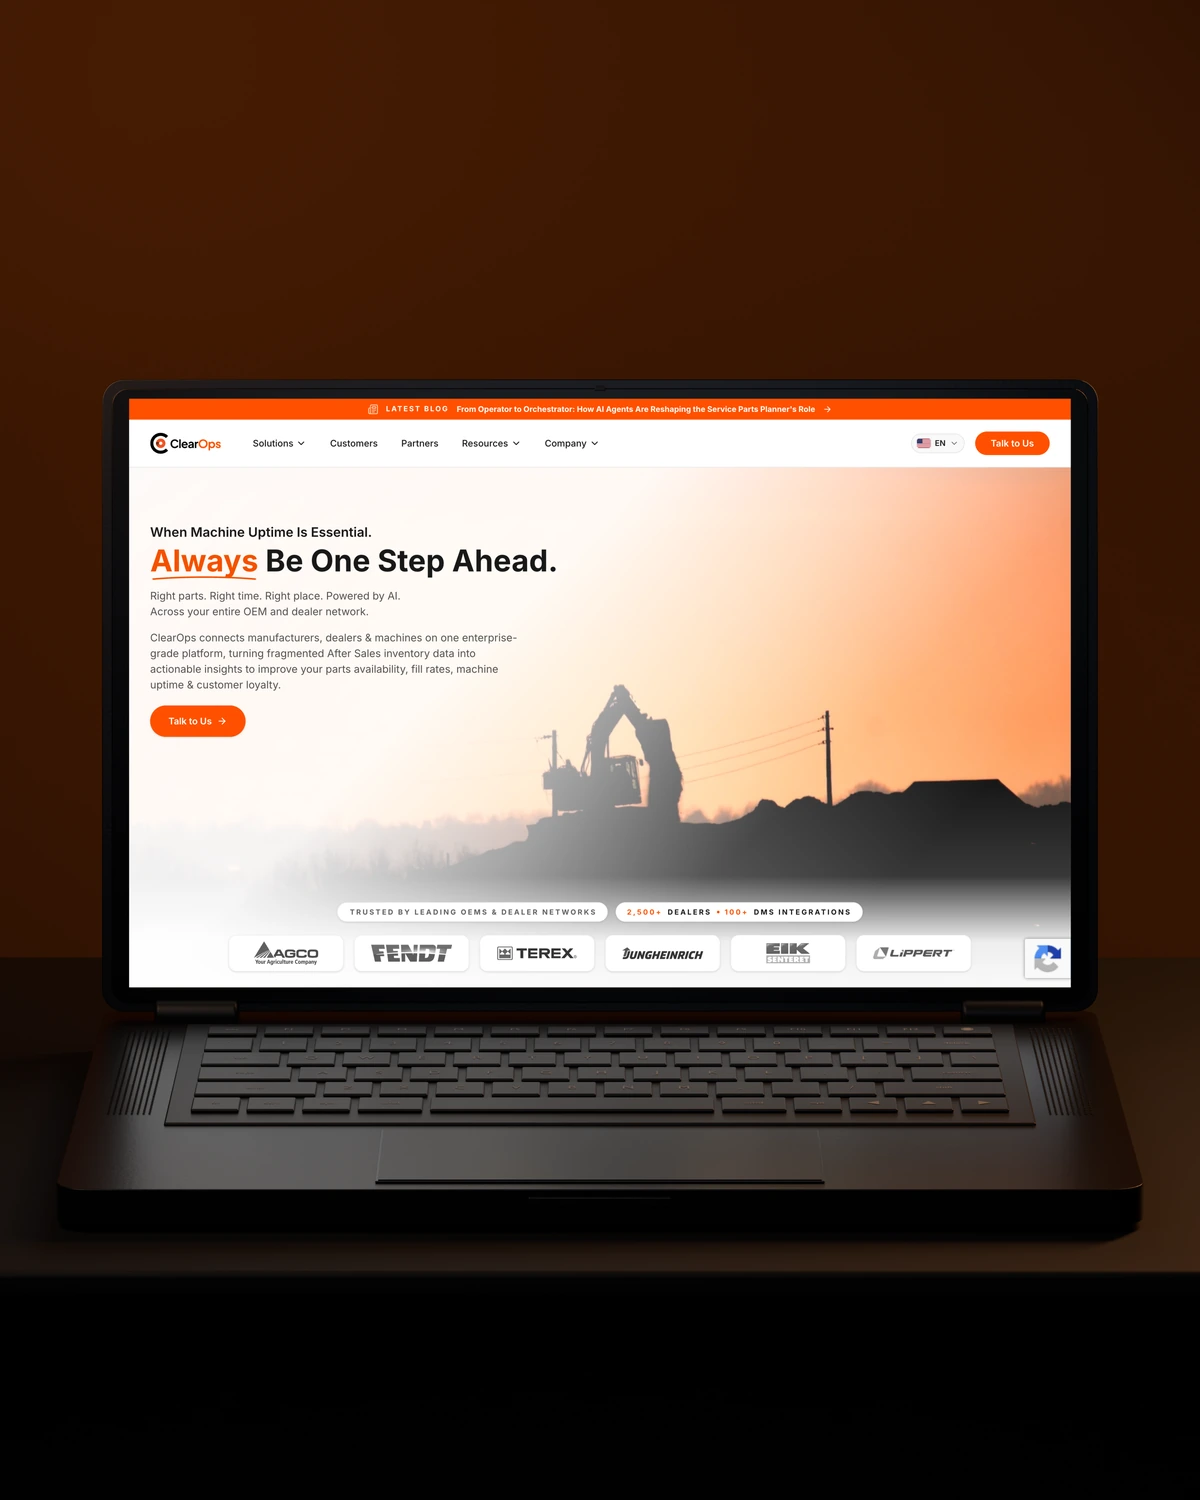
 Built to driveMore qualified demos.
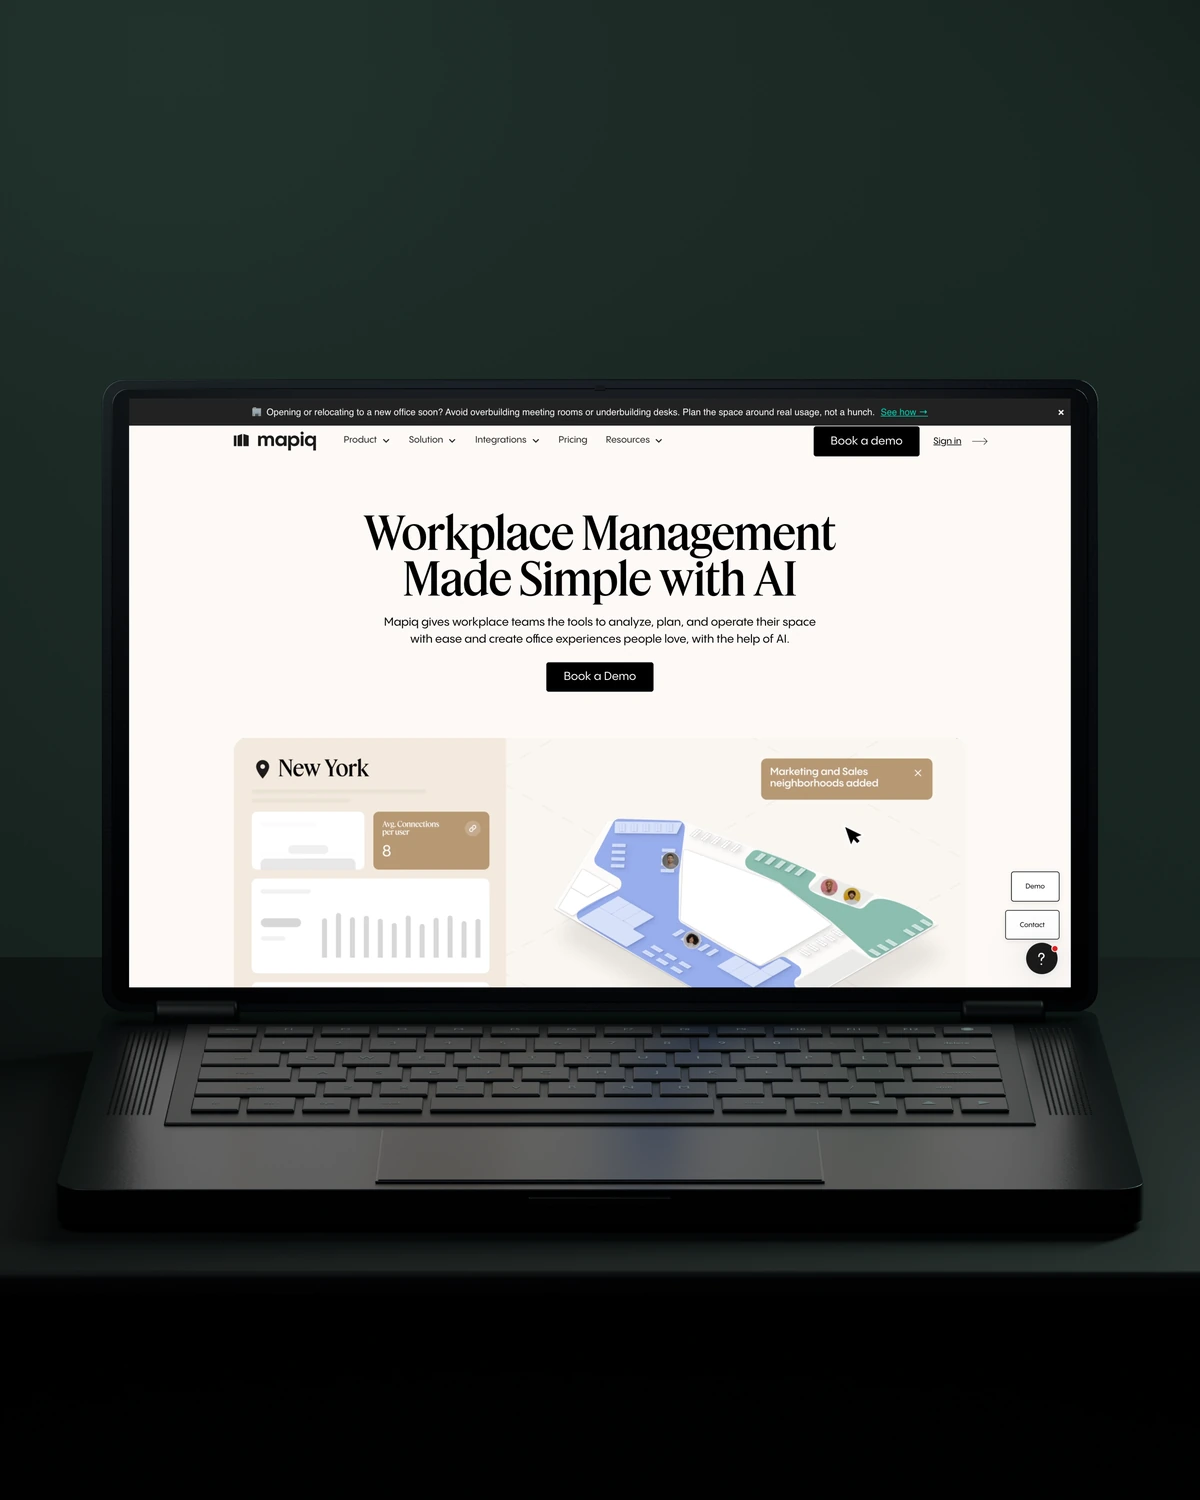
 Built to driveMore workplace demos.

 Built to driveMore business accounts.
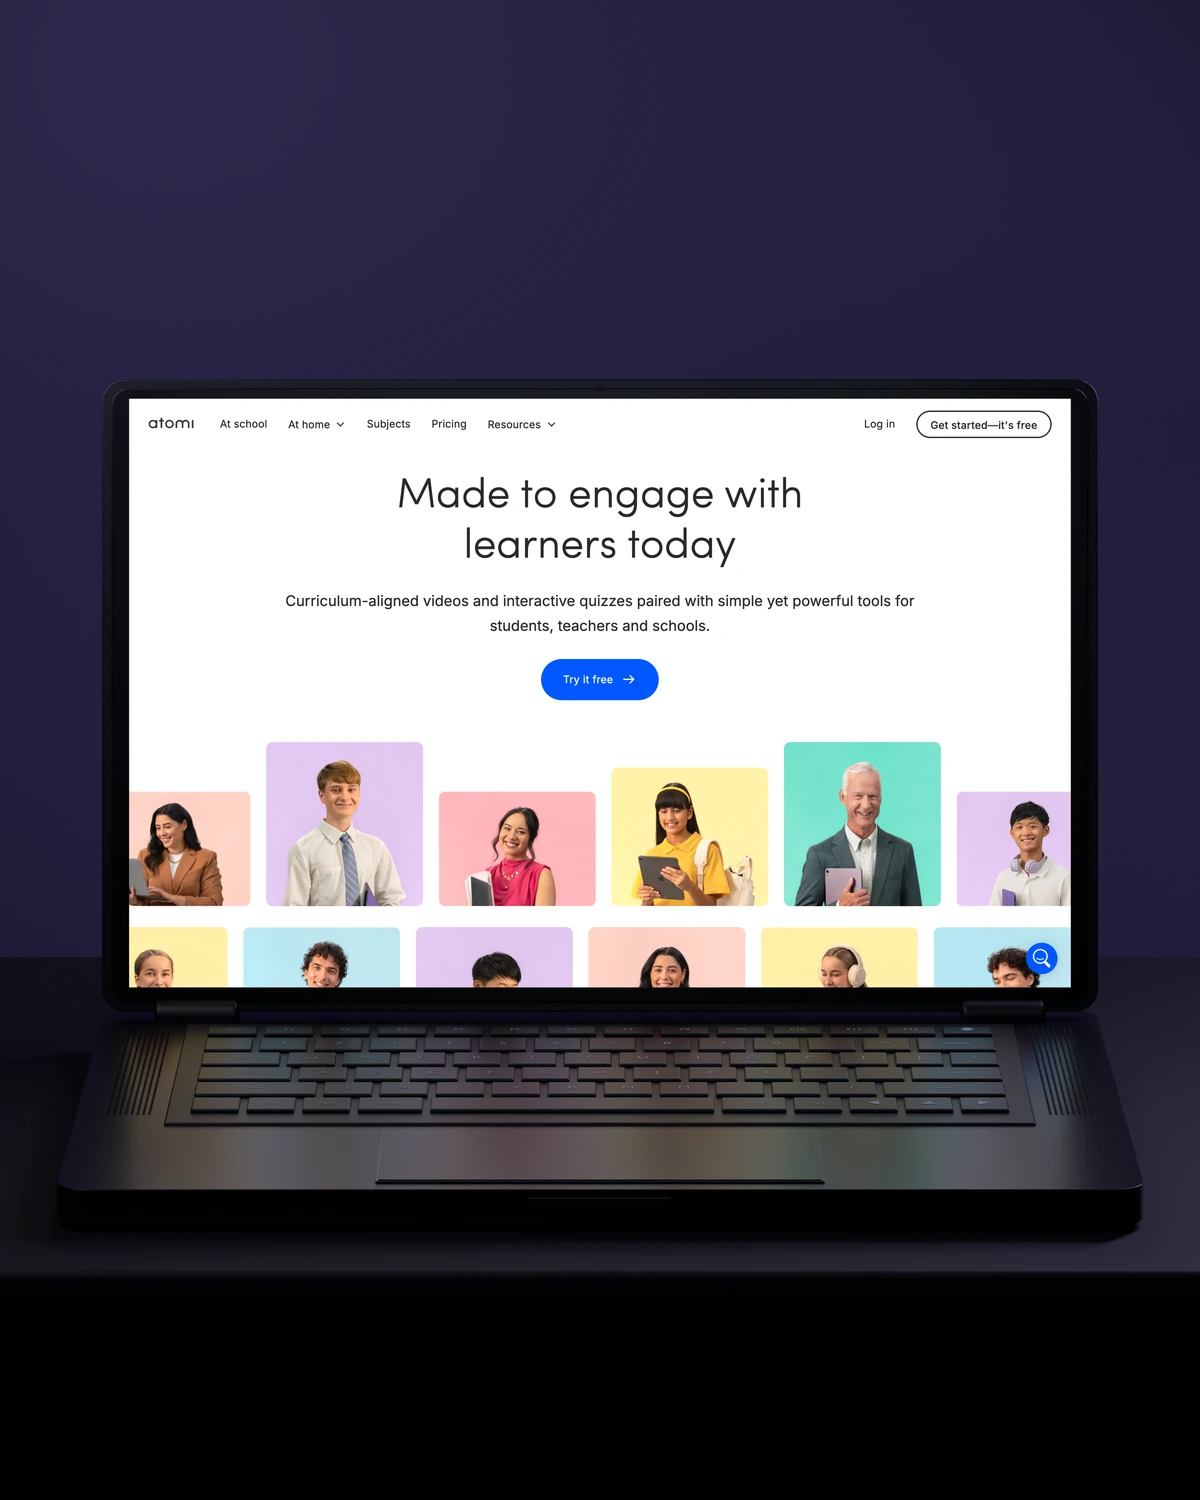
 Built to driveMore free trials.

 Built to driveMore building owners.
 Built to driveMore free sign-ups.
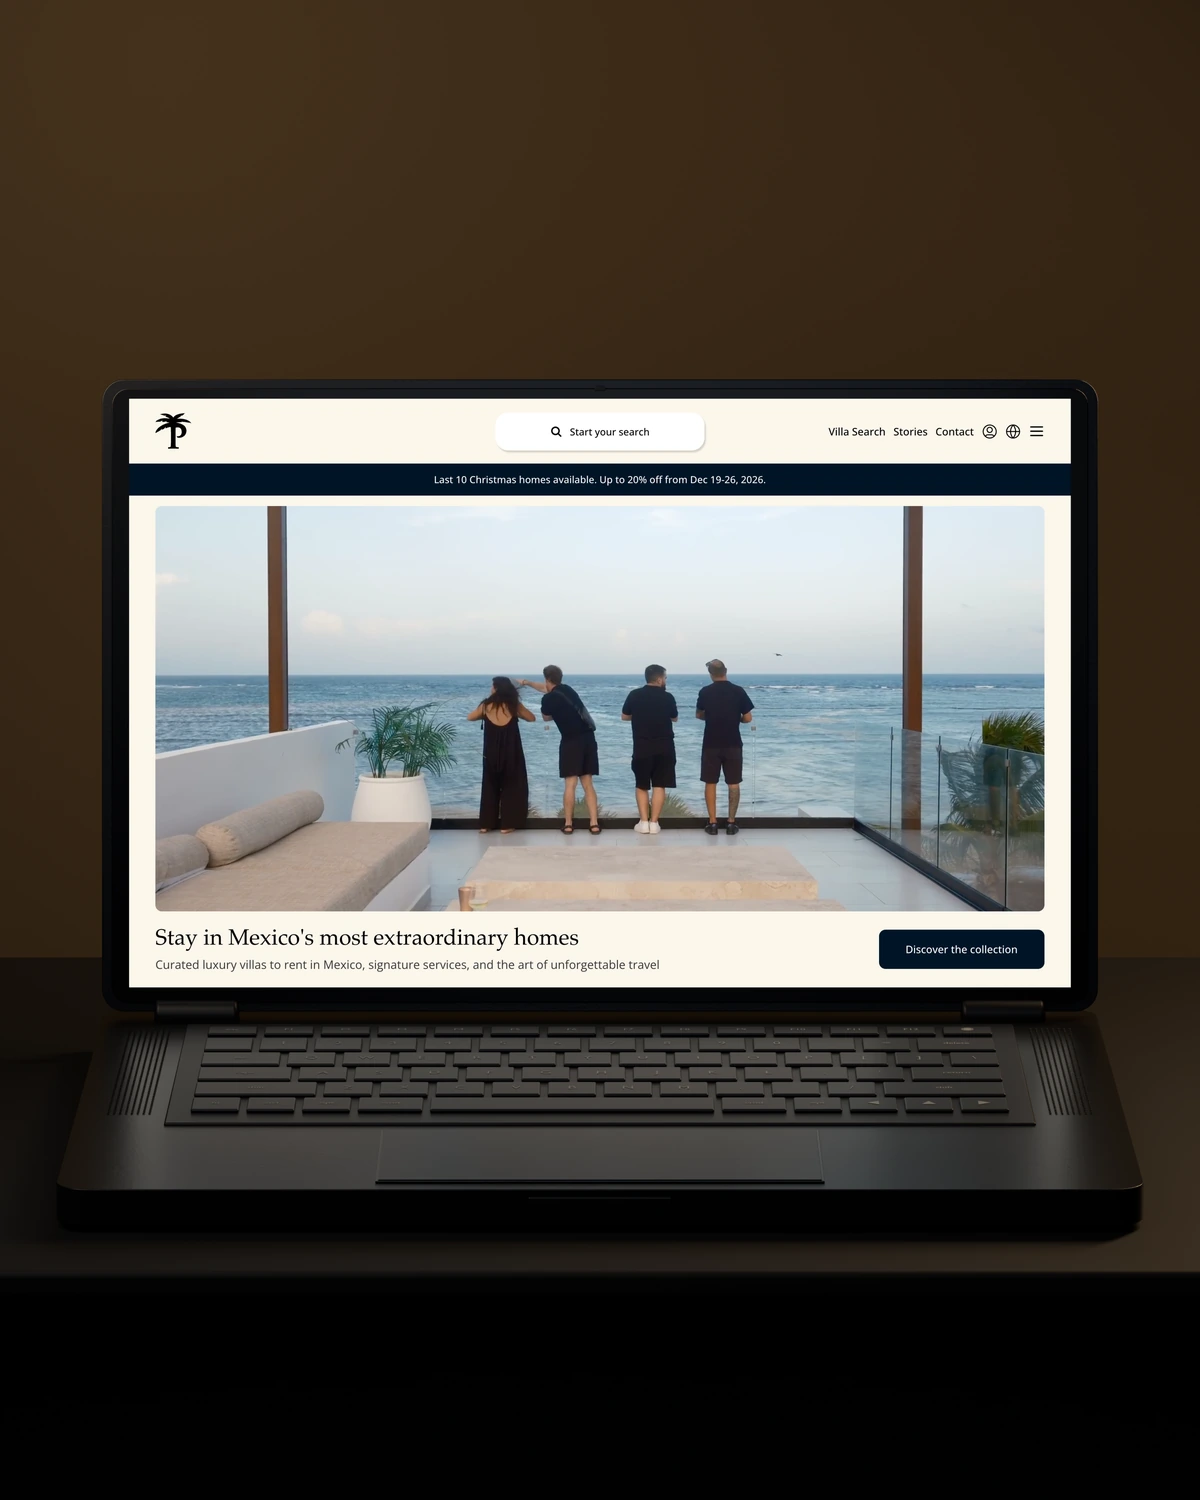
 Private Villas Mexico
 Built to driveMore direct bookings.
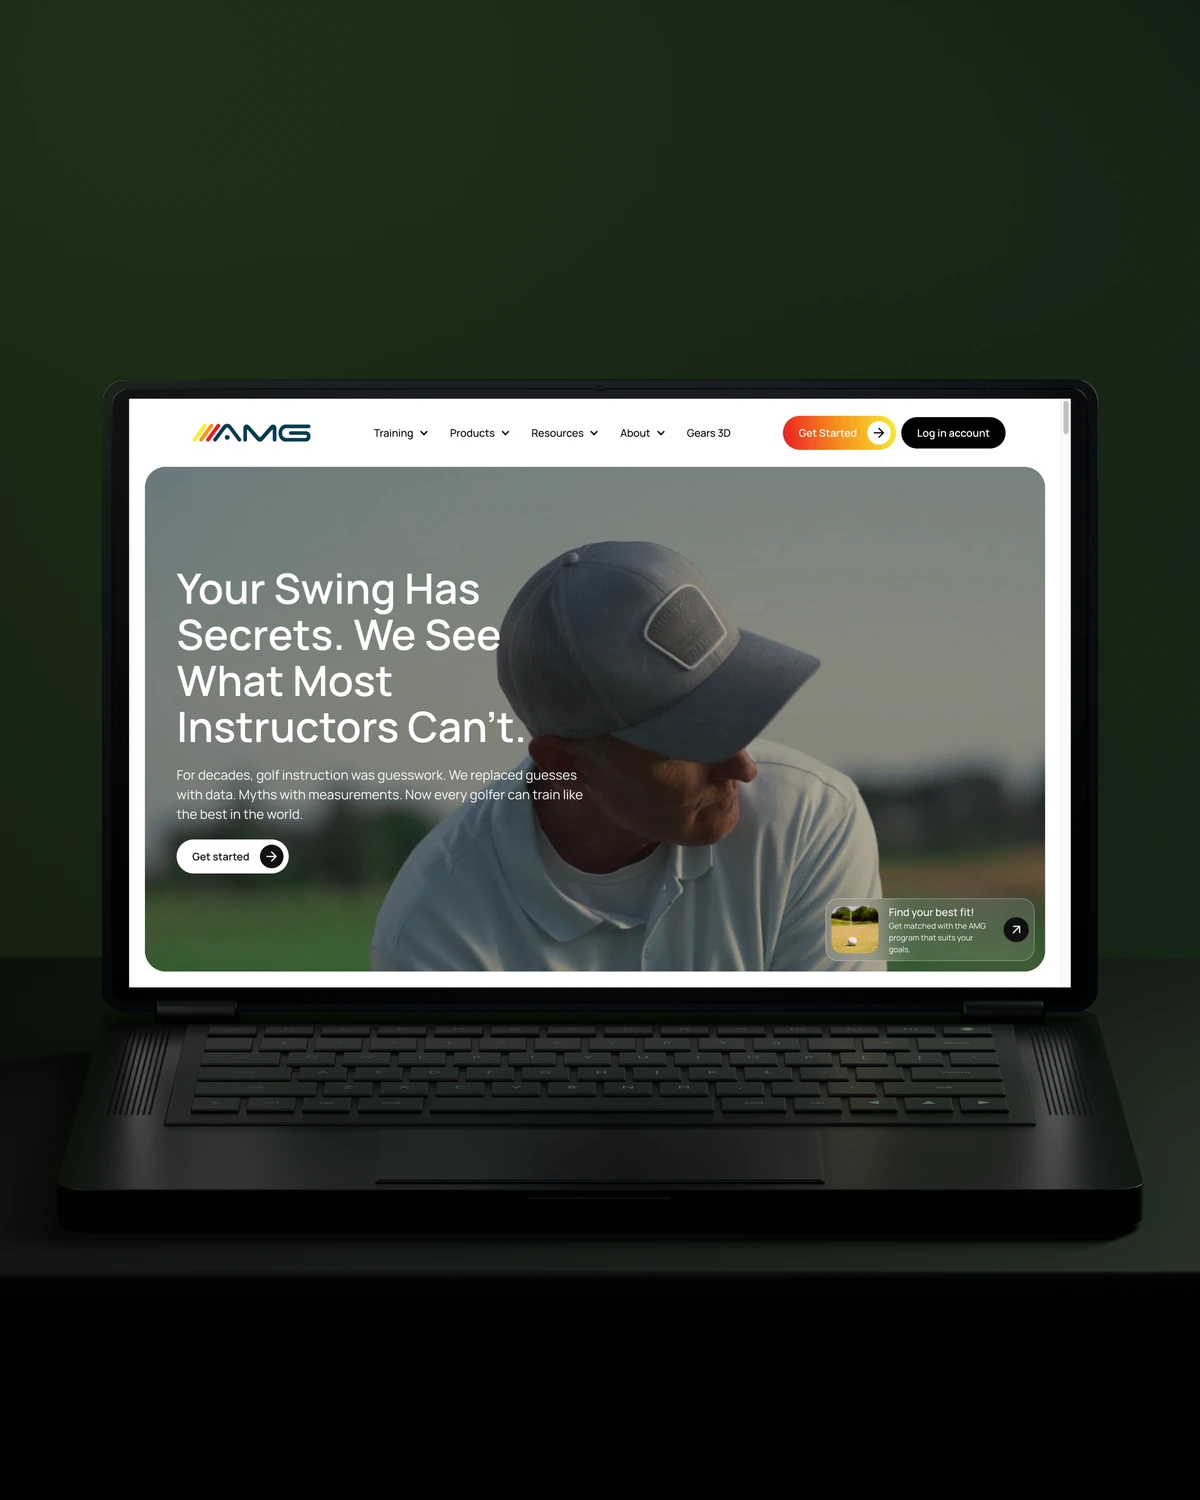
 Built to driveMore committed players.

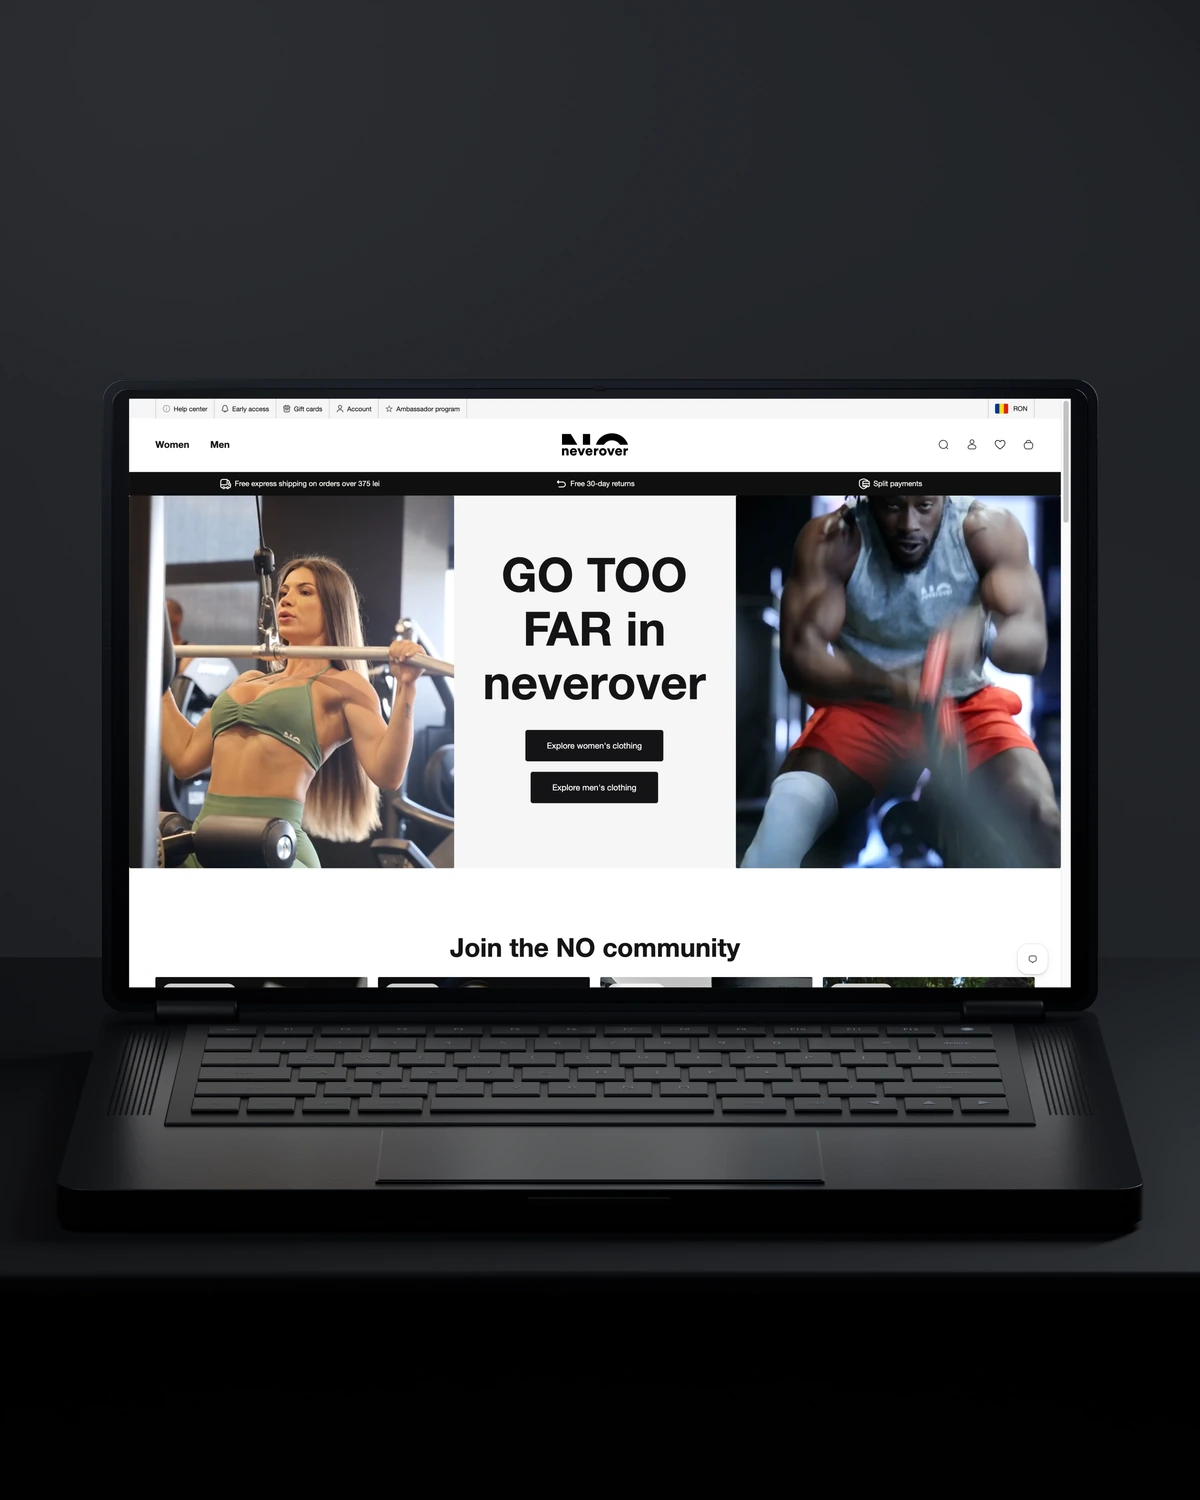
 Built to driveMore returning customers.

 Built to driveMore meaningful demos.
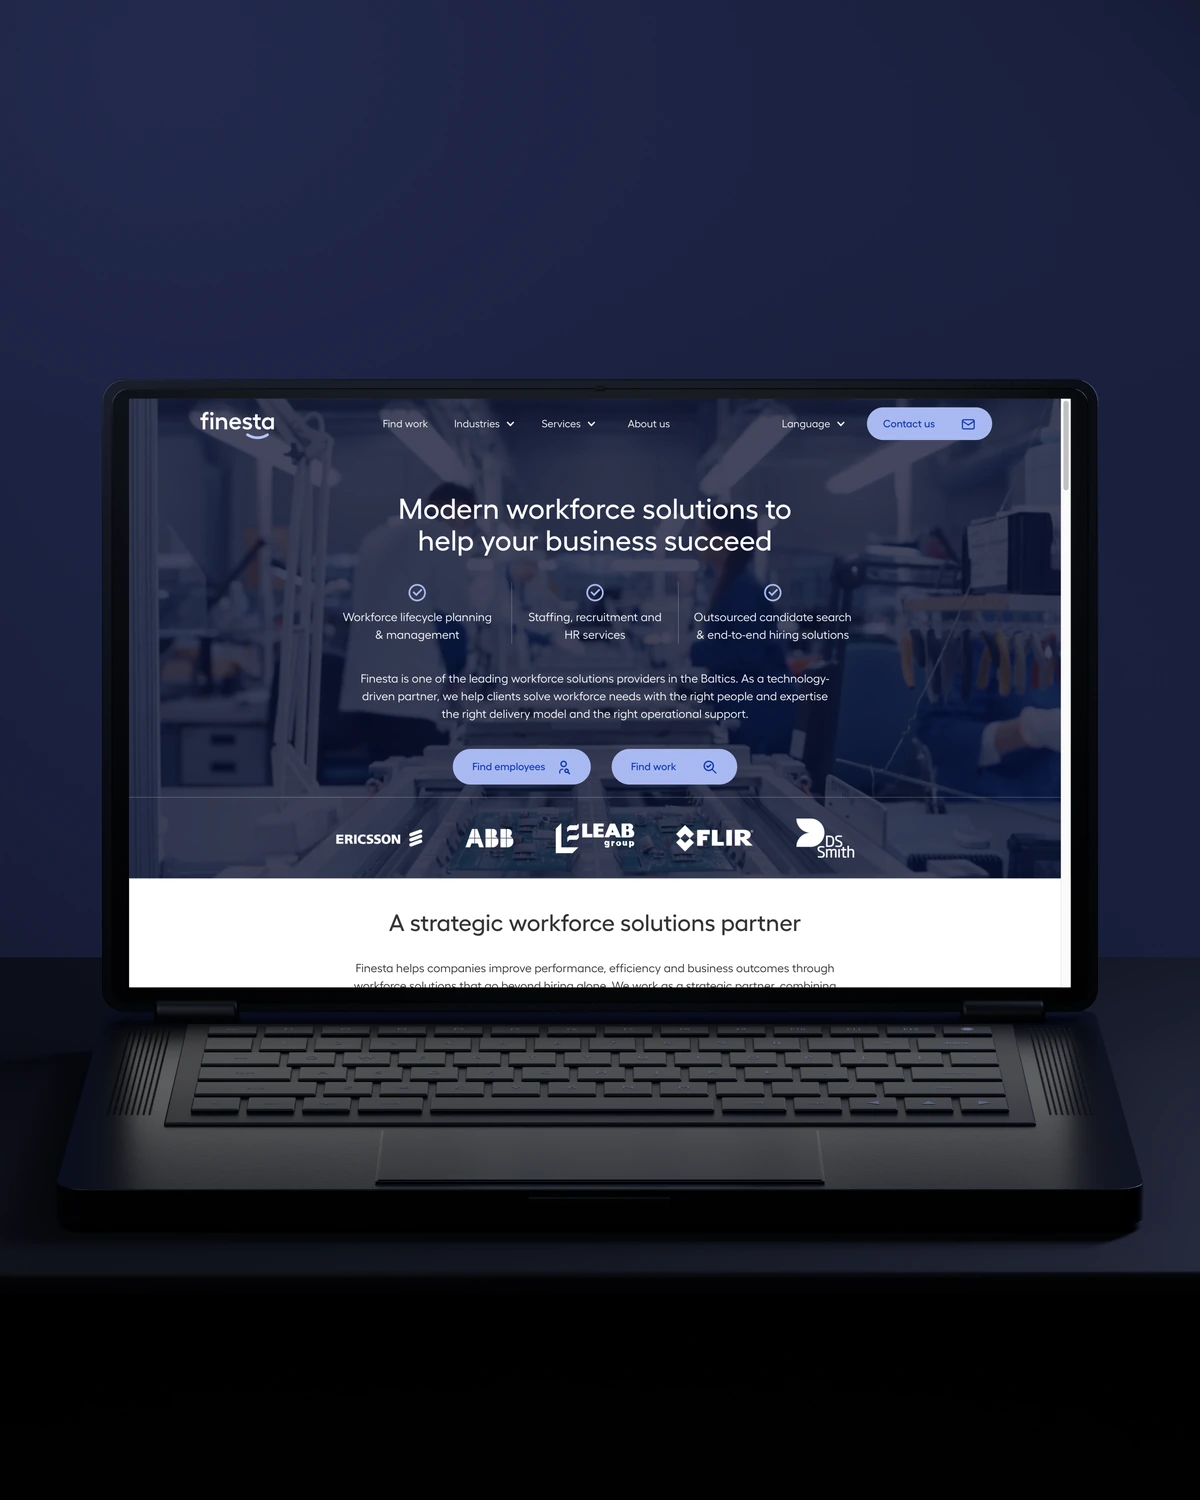
 Built to driveBetter talent connections.

 Built to driveMore course creators.
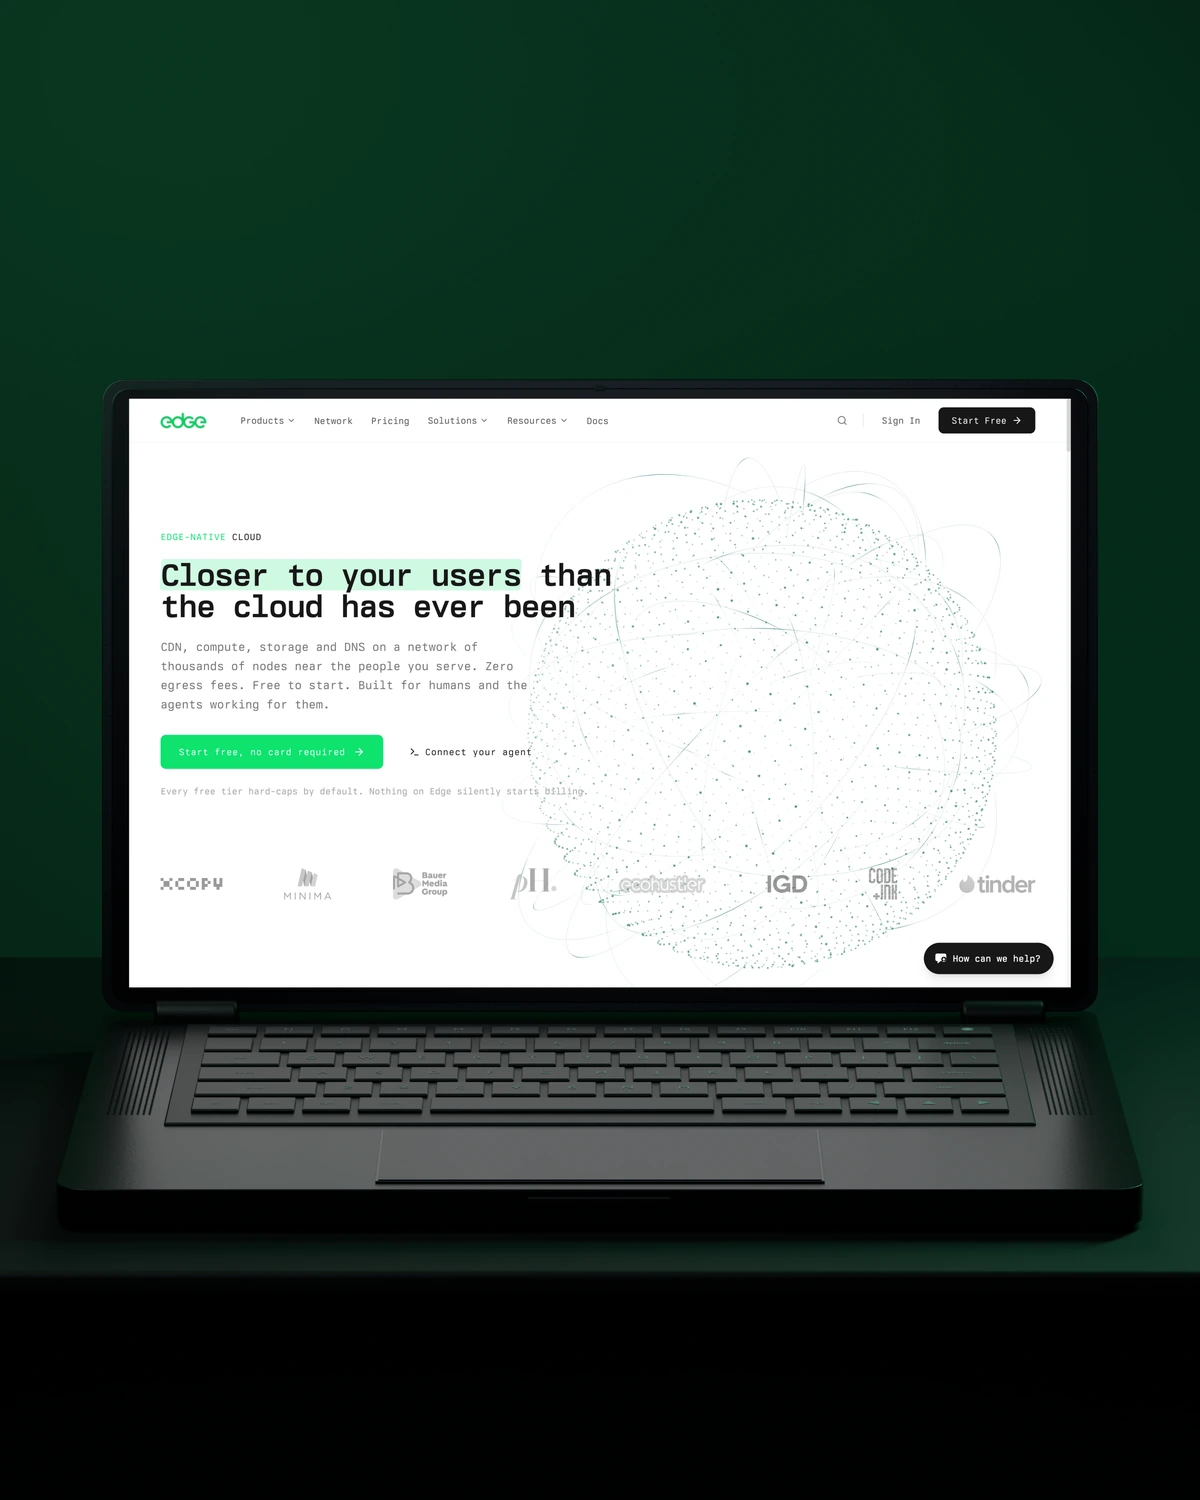
 Built to driveMore product discovery.
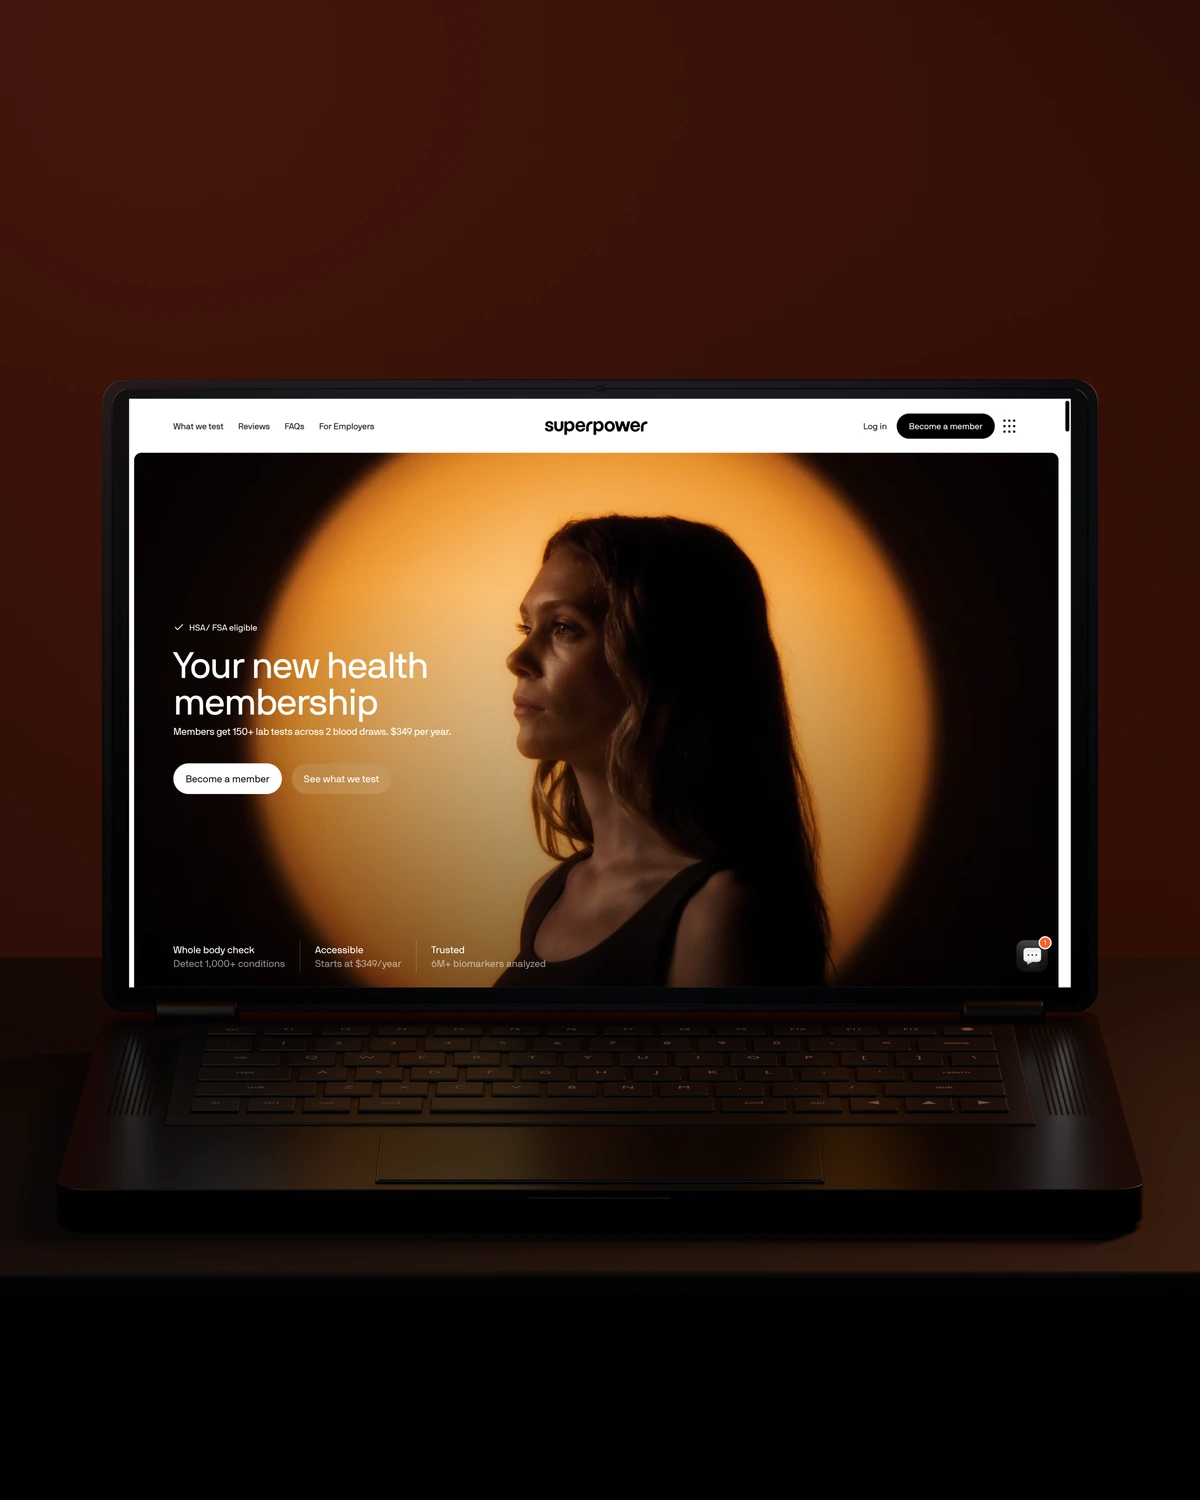
 Built to driveMore sign-ups.
Trusted across our practice
Independent reviews. Long-term working relationships.


“We’ve been working with Stega & Gabriel for the last two years. Cannot recommend them enough. They’re responsive, professional & an asset.”
“After a website (re)launch, they are also always accessible and happy to help. I highly recommend everyone who is looking for a new and more stable website in Webflow, to work with Stega!”
“Stega Creative team not only understood our needs and vision for the websites, but they also came up with improvements.”
A few things worth discussing before your PostHog product analytics takes shape.
PostHog trends count how often something happens over time, funnels show how many users complete a sequence of steps, and paths show the routes users actually take. We use trends for health metrics, funnels for conversion and paths to find the detours users take that nobody designed.
PostHog measures retention with a retention insight that groups users by when they first did something, then shows how many come back. We choose the start and return events carefully, because retention built on pageviews says far less than retention built on a real product action.
PostHog product analytics shows where users drop off, and session replay helps show why. From any funnel step you can open replays of the people who left there. Watching ten of them often explains more than another breakdown, and in-app surveys can ask the rest directly.
If events are missing or unreliable, we fix them first, which adds an implementation phase. You see funnels and cohorts as they are built, so feedback shapes the rest of the work.
way.Your ambition. Our collective craft.
Strategy, design and technology, working as one.