



















Gather model requirements
Interviews with marketing, product and leadership turned into a list of questions, metrics and the level of detail each one needs.


 4.9 / 5
Databricks analytics that turns lakehouse tables into reporting datasets and dashboards shaped around what your marketing and product teams ask.
Selected work, in motion.
The digital experiences that connect to a wider business system.When every analyst defines revenue or conversion their own way, the lakehouse produces arguments instead of answers.
What's included
We start with the questions your teams need answered, then model only the data those answers need.
Interviews with marketing, product and leadership turned into a list of questions, metrics and the level of detail each one needs.
Gold tables and metric views in Unity Catalog, modelled for the reports they serve and documented so analysts can find them.
Totals checked against the CRM, billing and analytics tools they come from, with differences explained before anyone relies on them.
Databricks AI/BI dashboards or your BI tool connected to the datasets, with a few focused views instead of dozens of tabs.
Security, by consideration.
For your Databricks project, we consider data sources, workspace permissions, pipelines and downstream consumers as part of one connected build.
See our approachGitHub workflows, peer review and dependency checks bring decisions into the release process.
Certificate configuration, HTTPS and secure headers help protect the path between your users and your systems.
Scoped tool access, validated inputs and human approval where automated actions carry consequences.
Every dataset ships with its definition and its validation.
Questions, metrics and definitions agreed with the people who will use them.
Reporting tables and views built in Databricks and documented in Unity Catalog.
Numbers reconciled with source systems, then dashboards built and handed over.
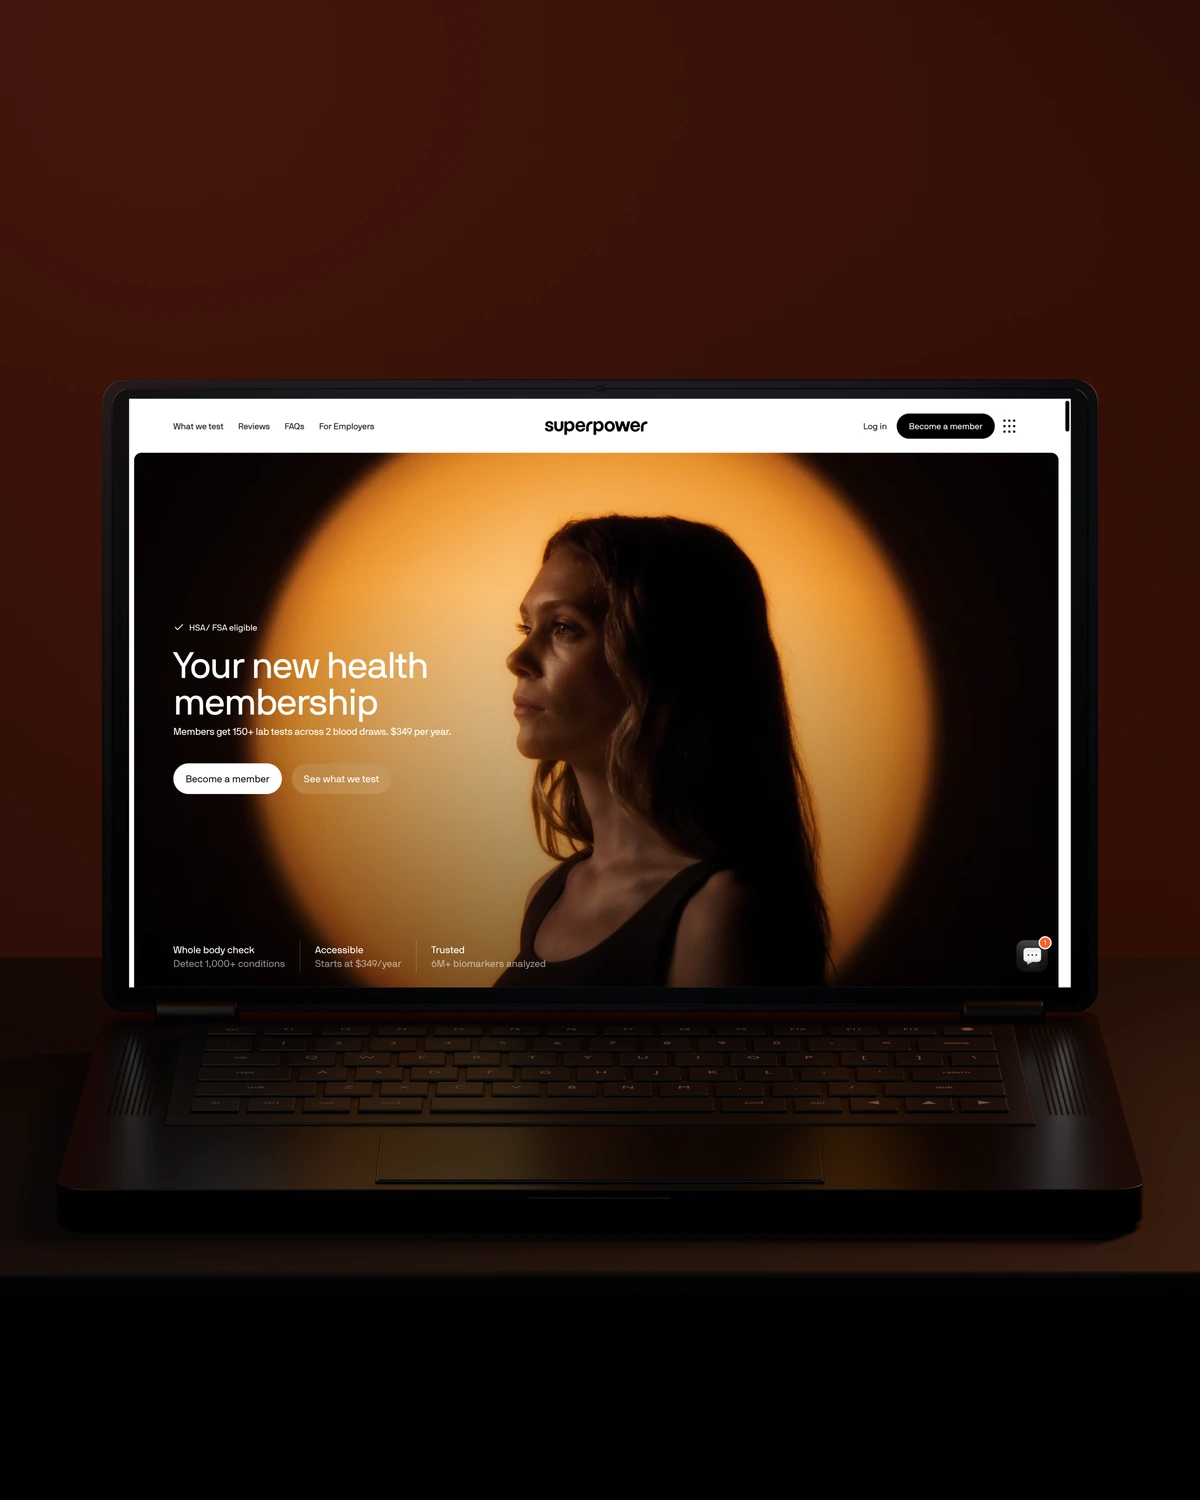


 Built to driveMore sign-ups.


 Built to driveMore memberships.
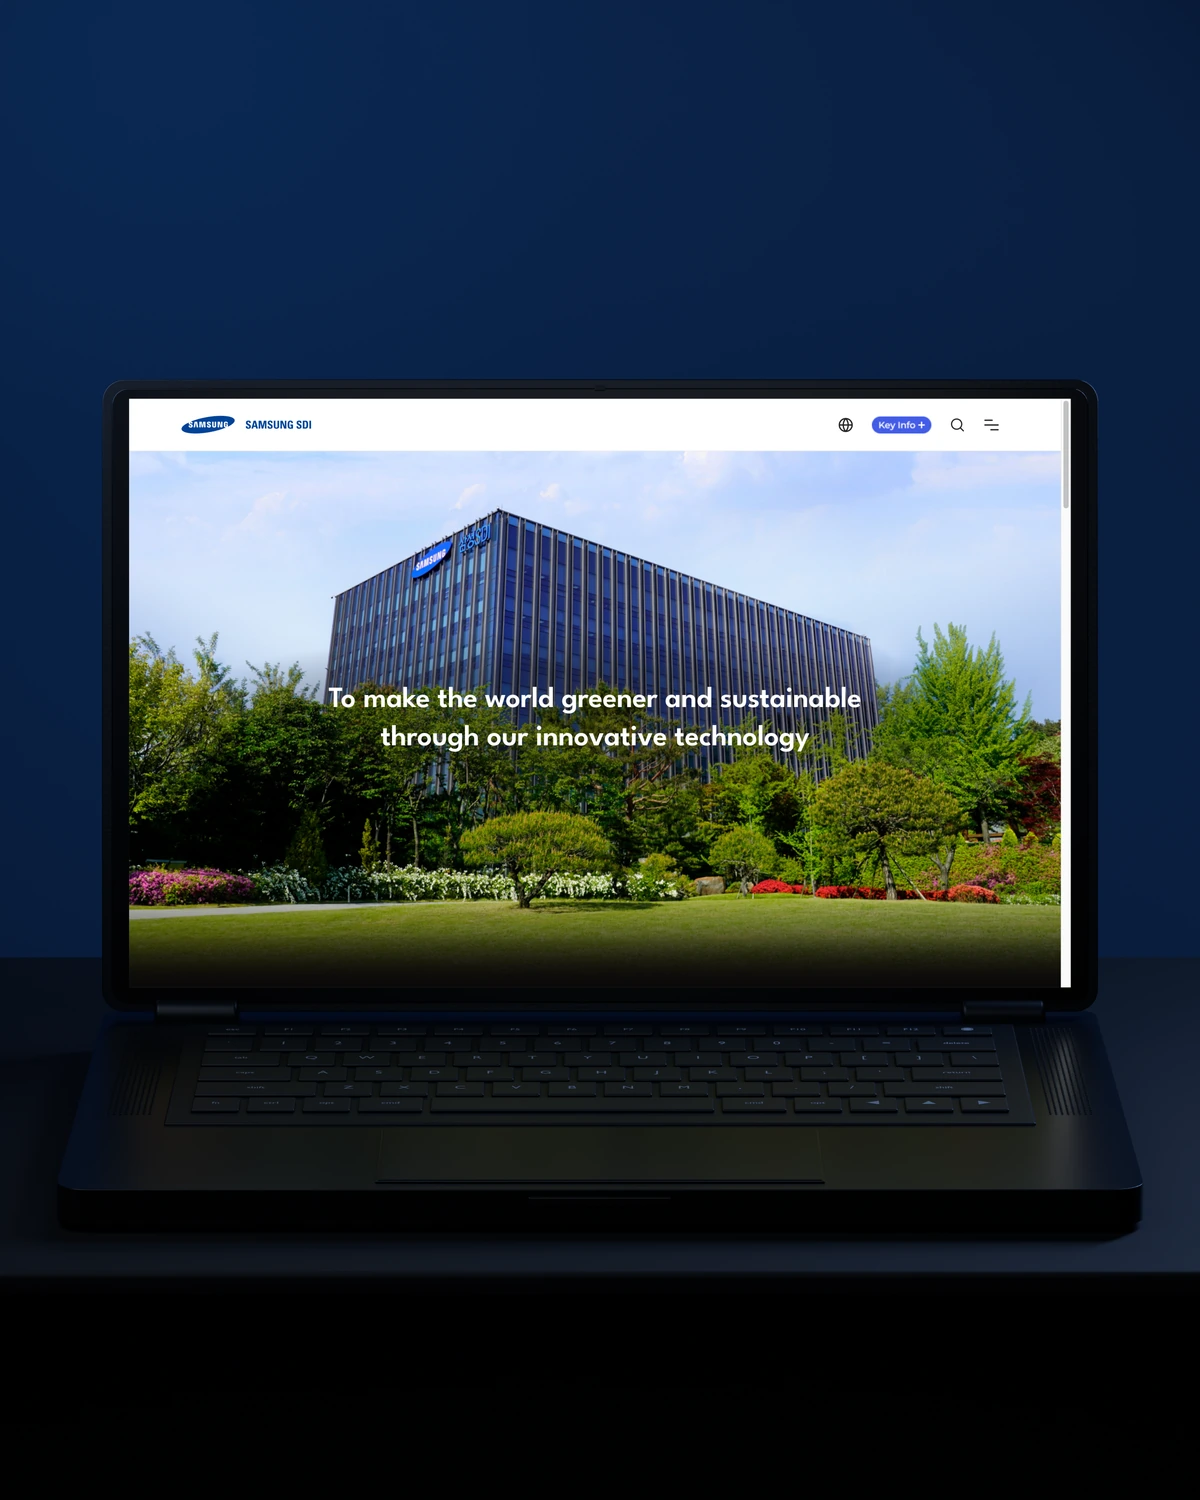

 Built to driveBetter-qualified leads.
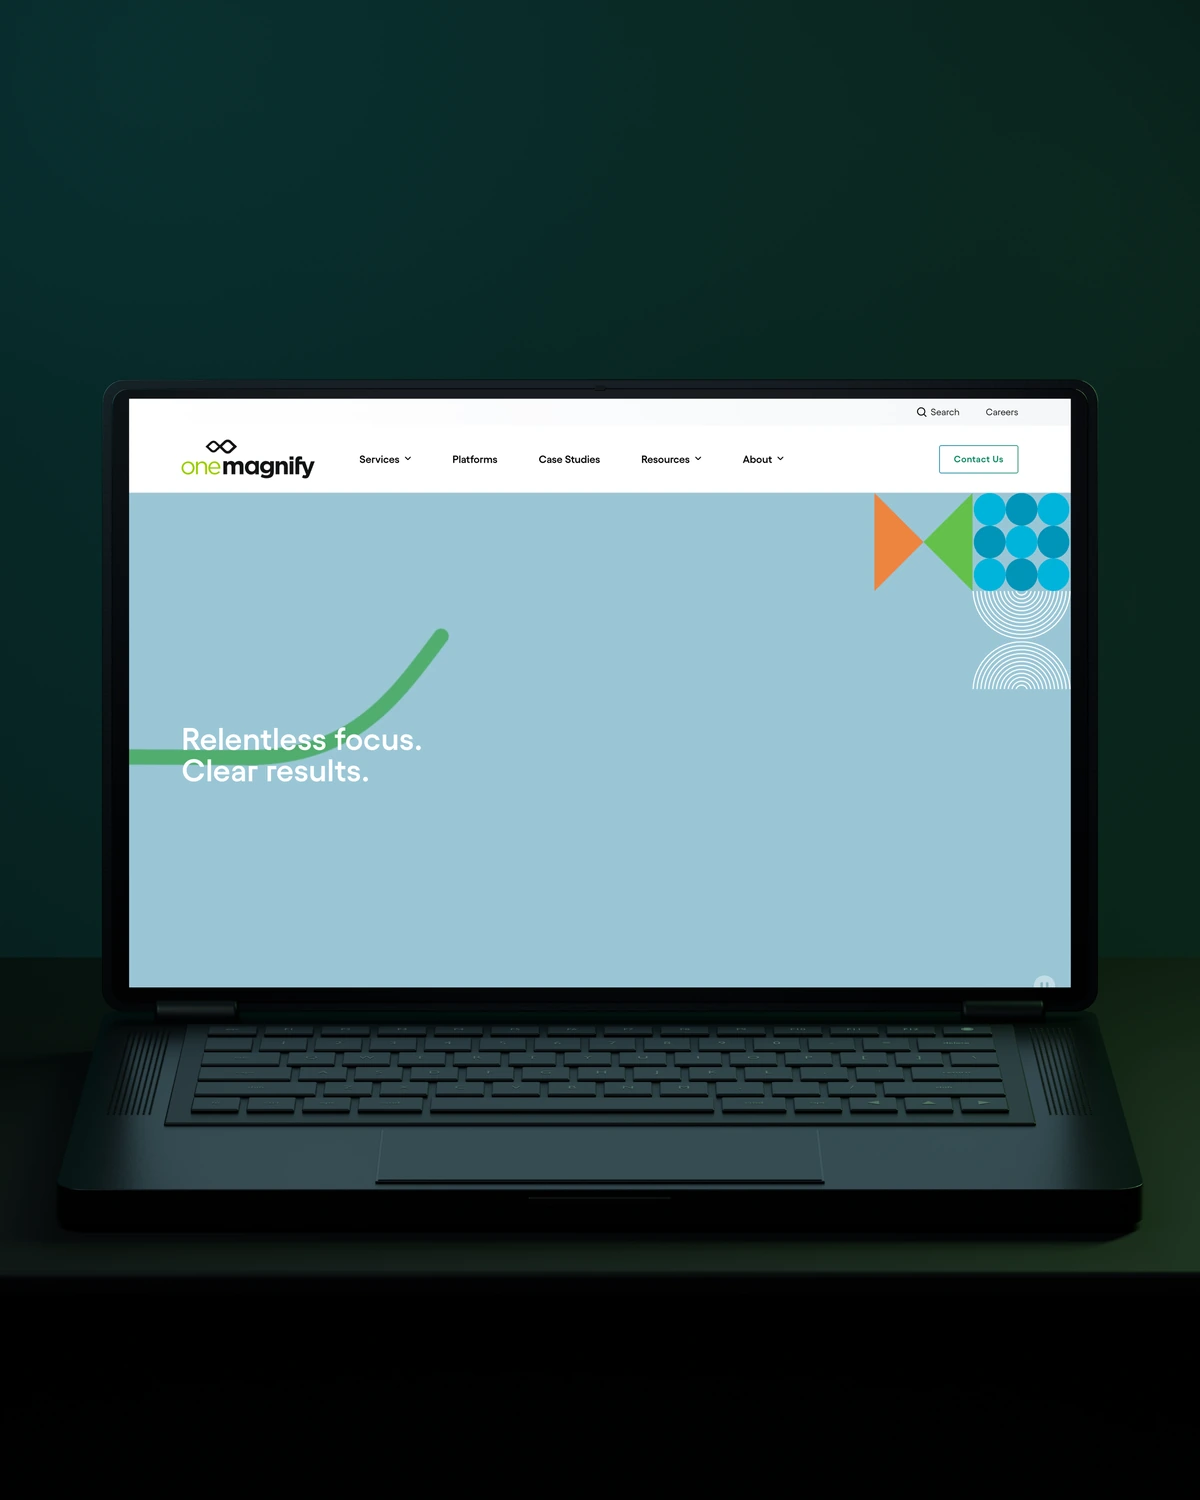
 Built to driveMore qualified candidates.



 Built to driveMore enquiries.

 Built to driveMore qualified demos.
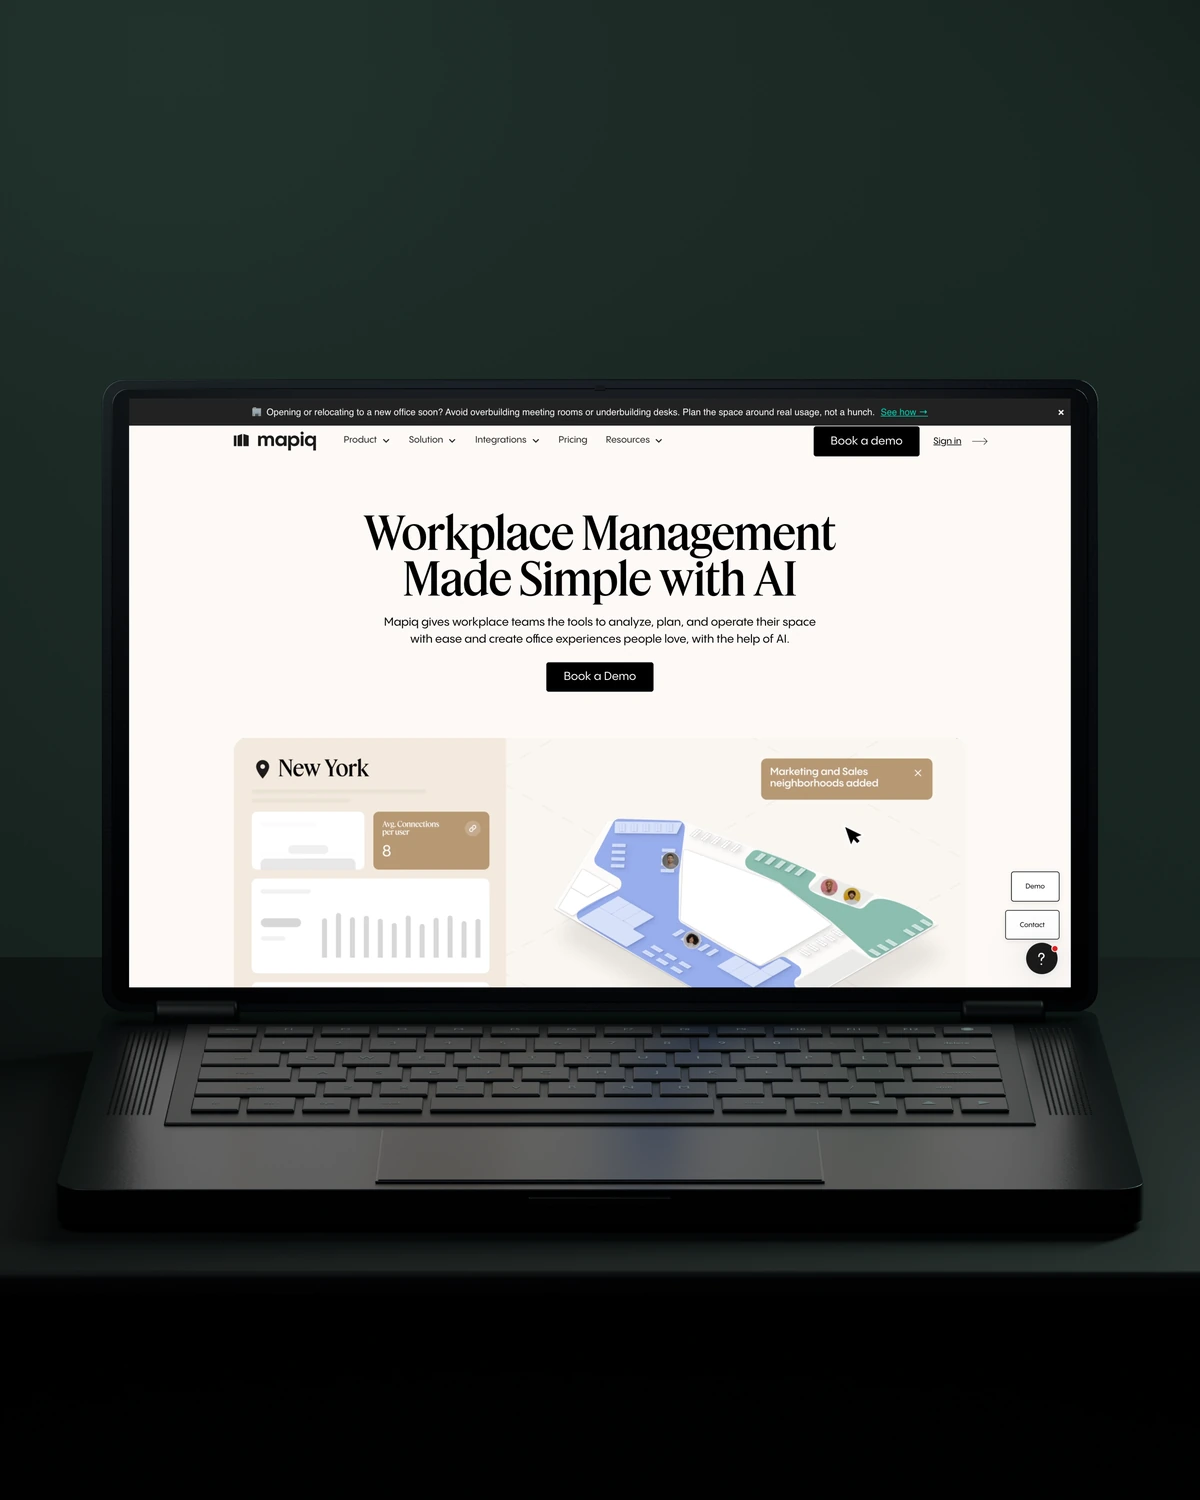
 Built to driveMore workplace demos.

 Built to driveMore business accounts.
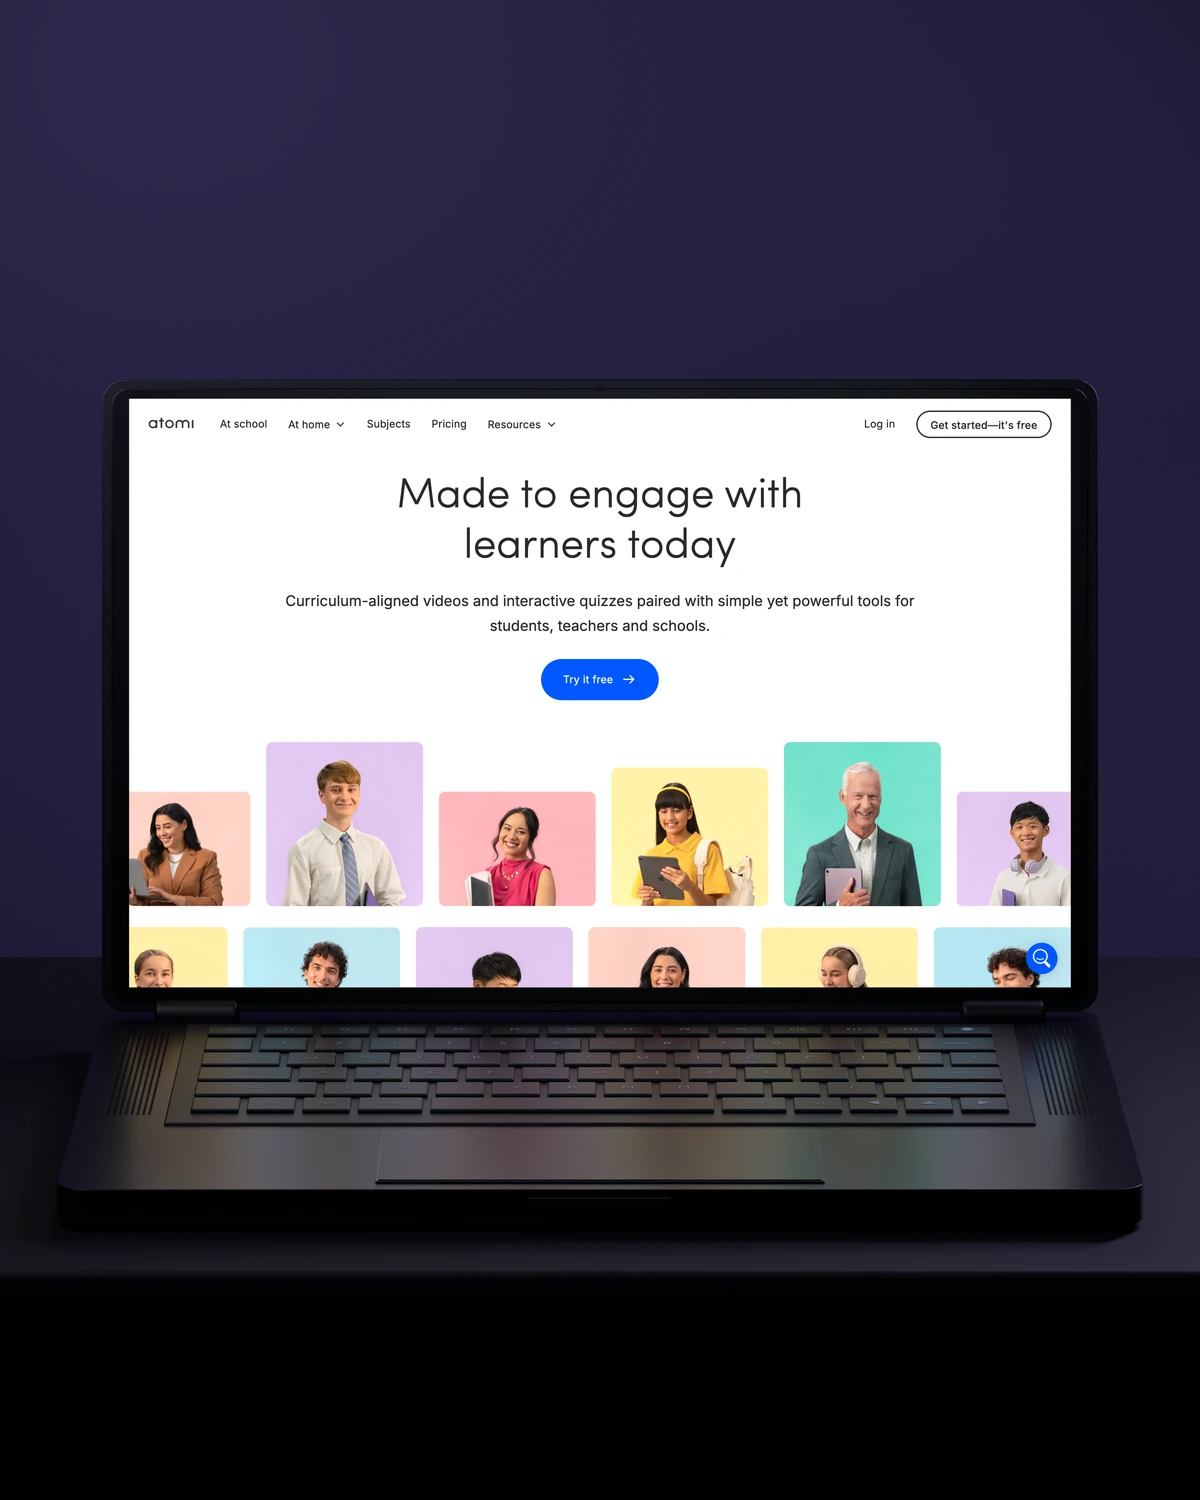
 Built to driveMore free trials.
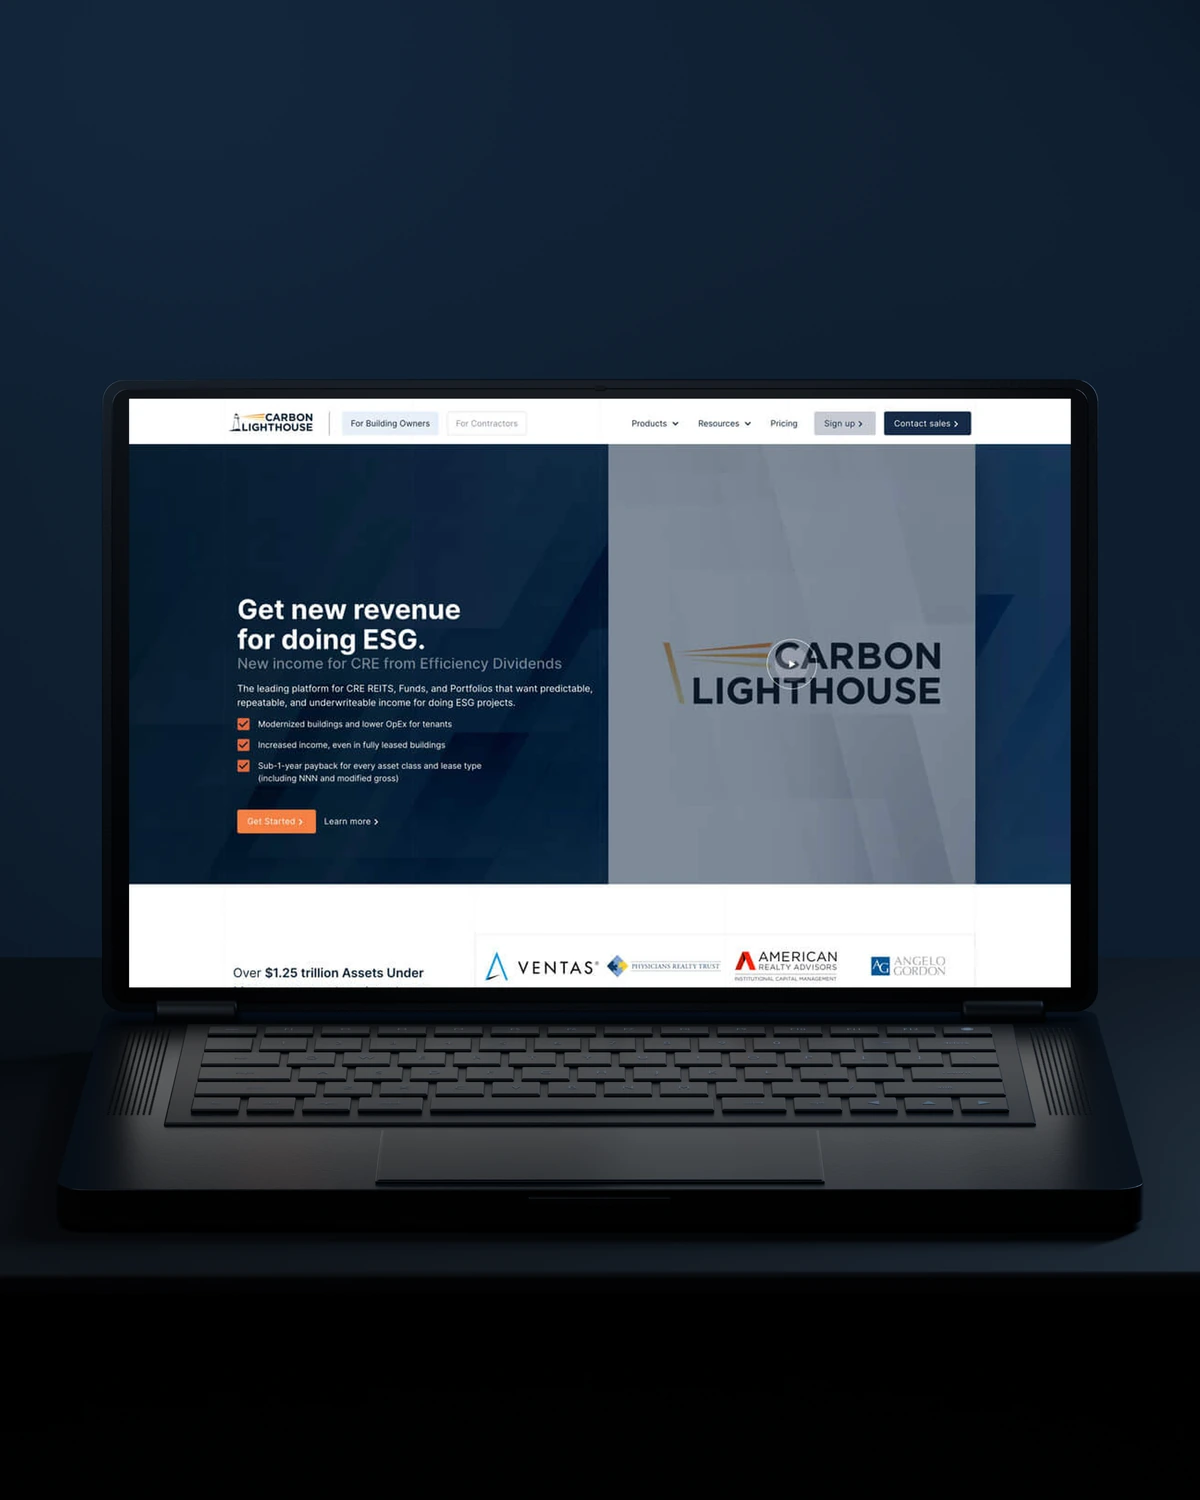
 Built to driveMore building owners.
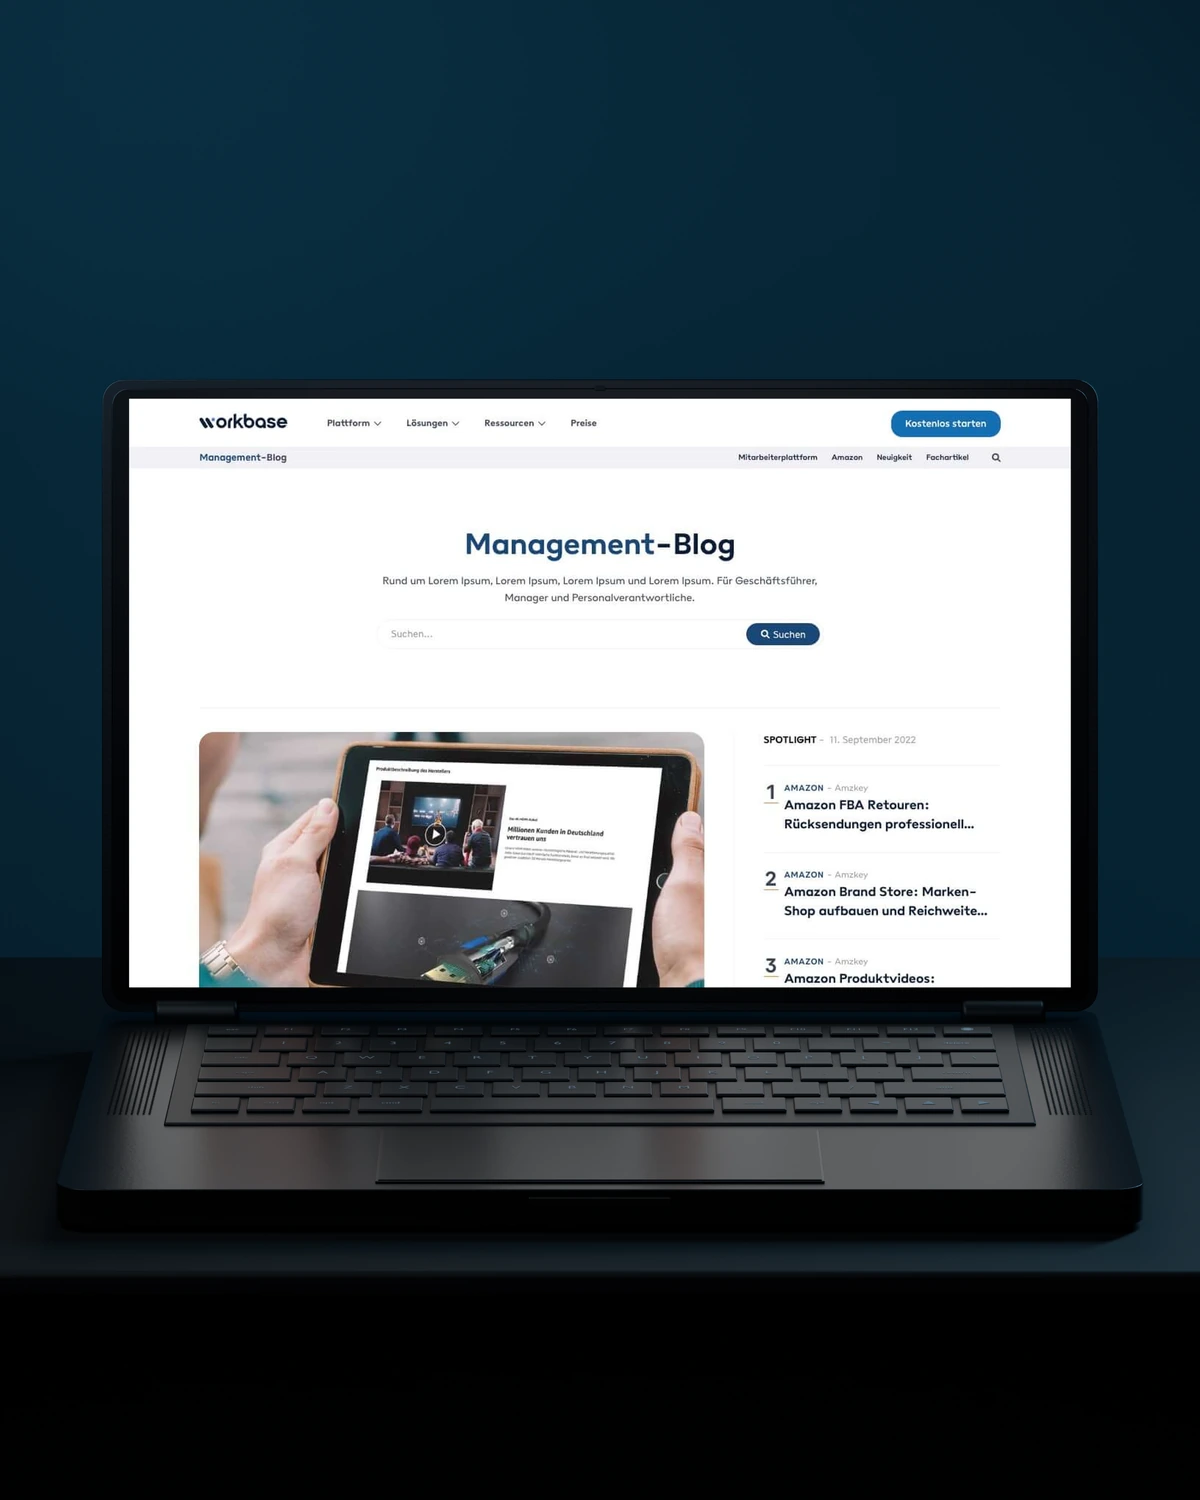
 Built to driveMore free sign-ups.
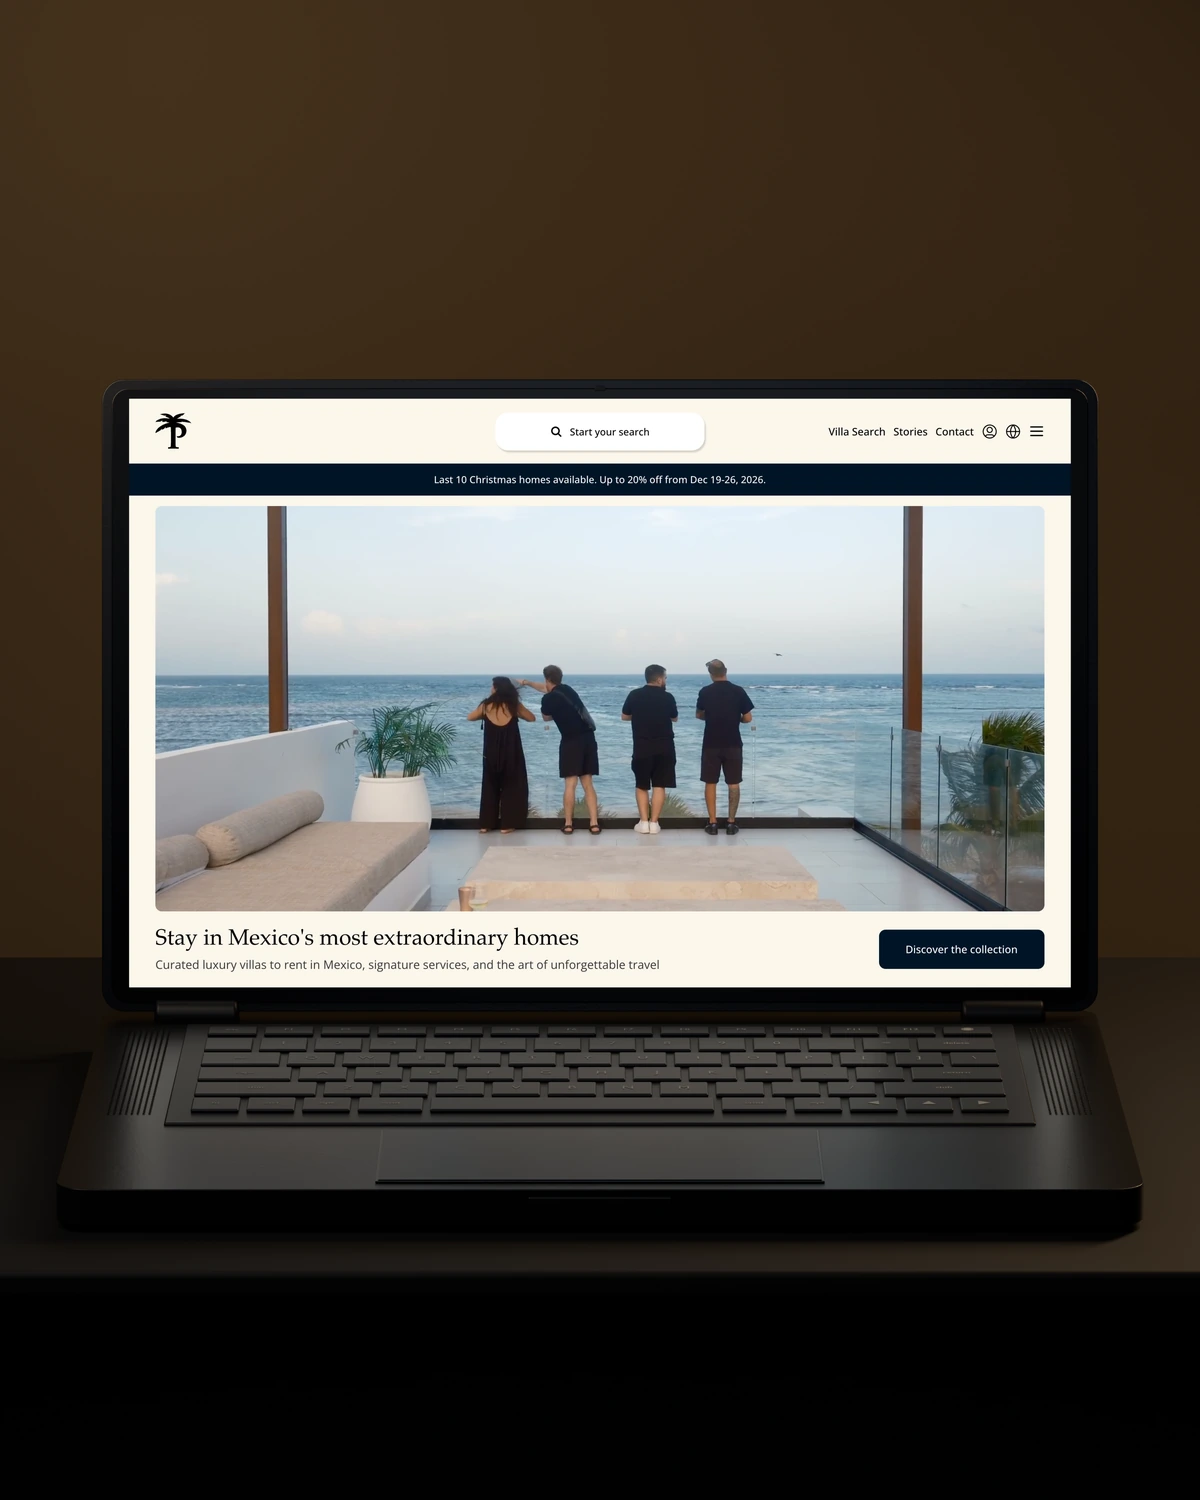
 Private Villas MexicoBuilt to driveMore direct bookings.

 Built to driveMore committed players.
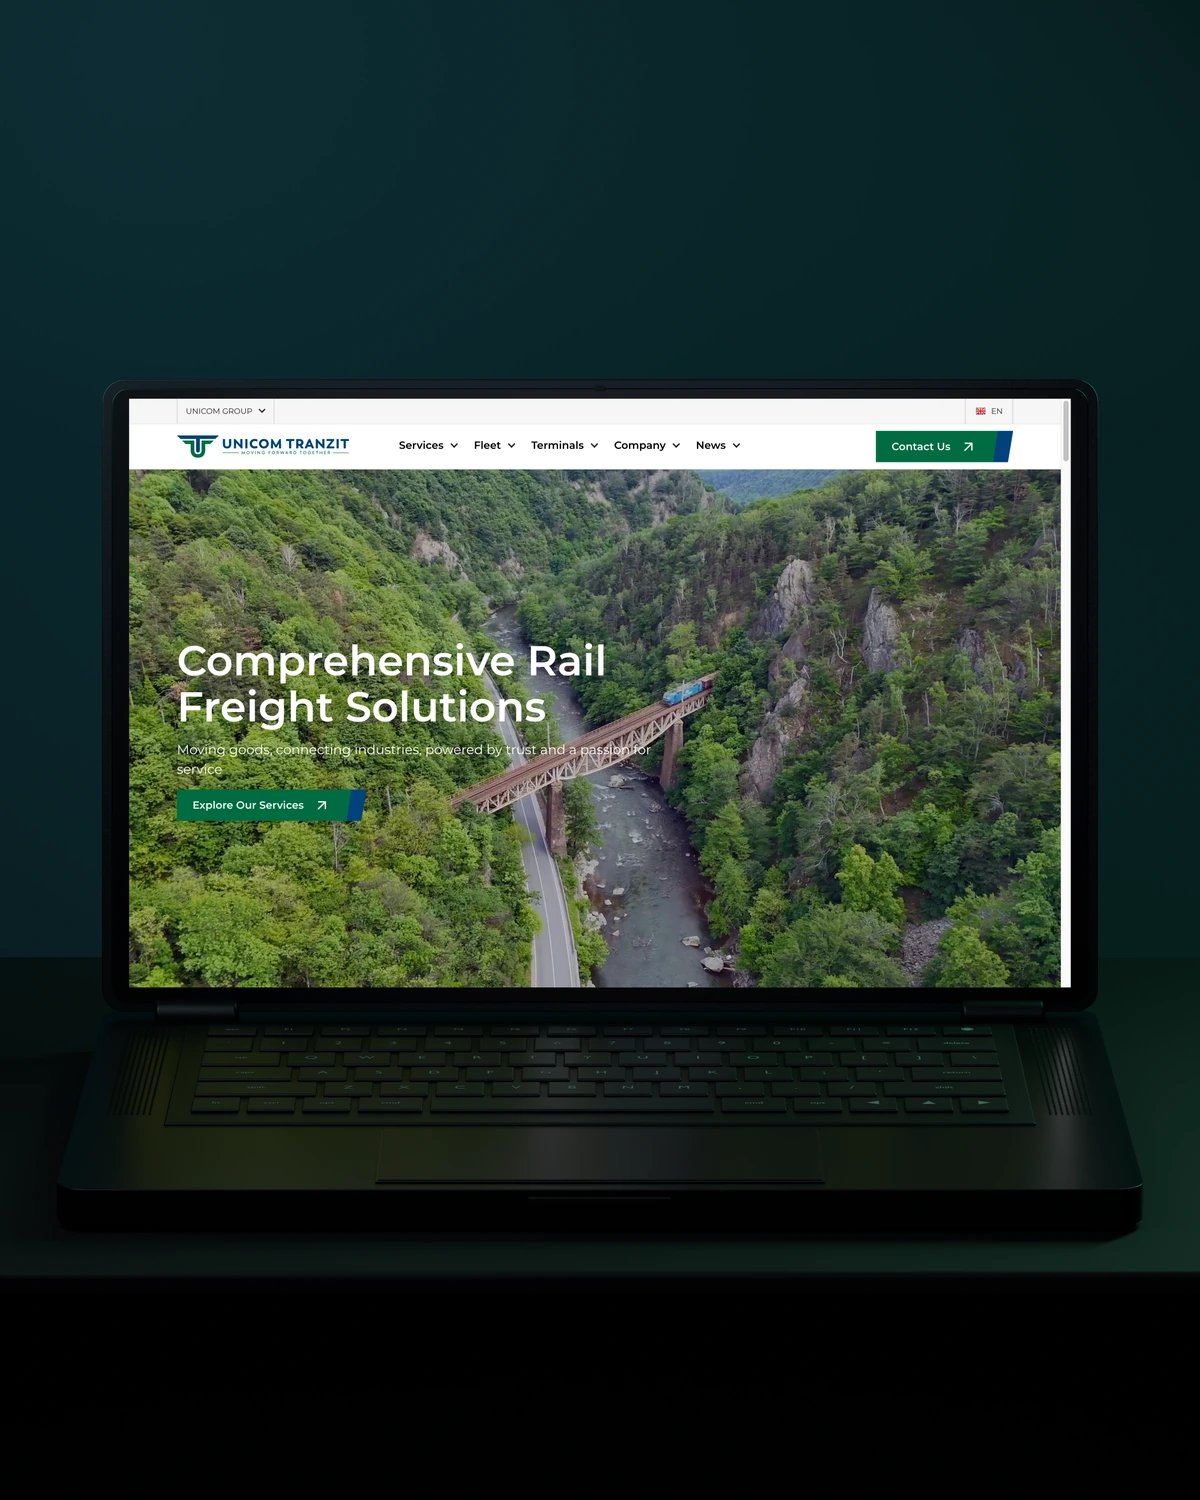

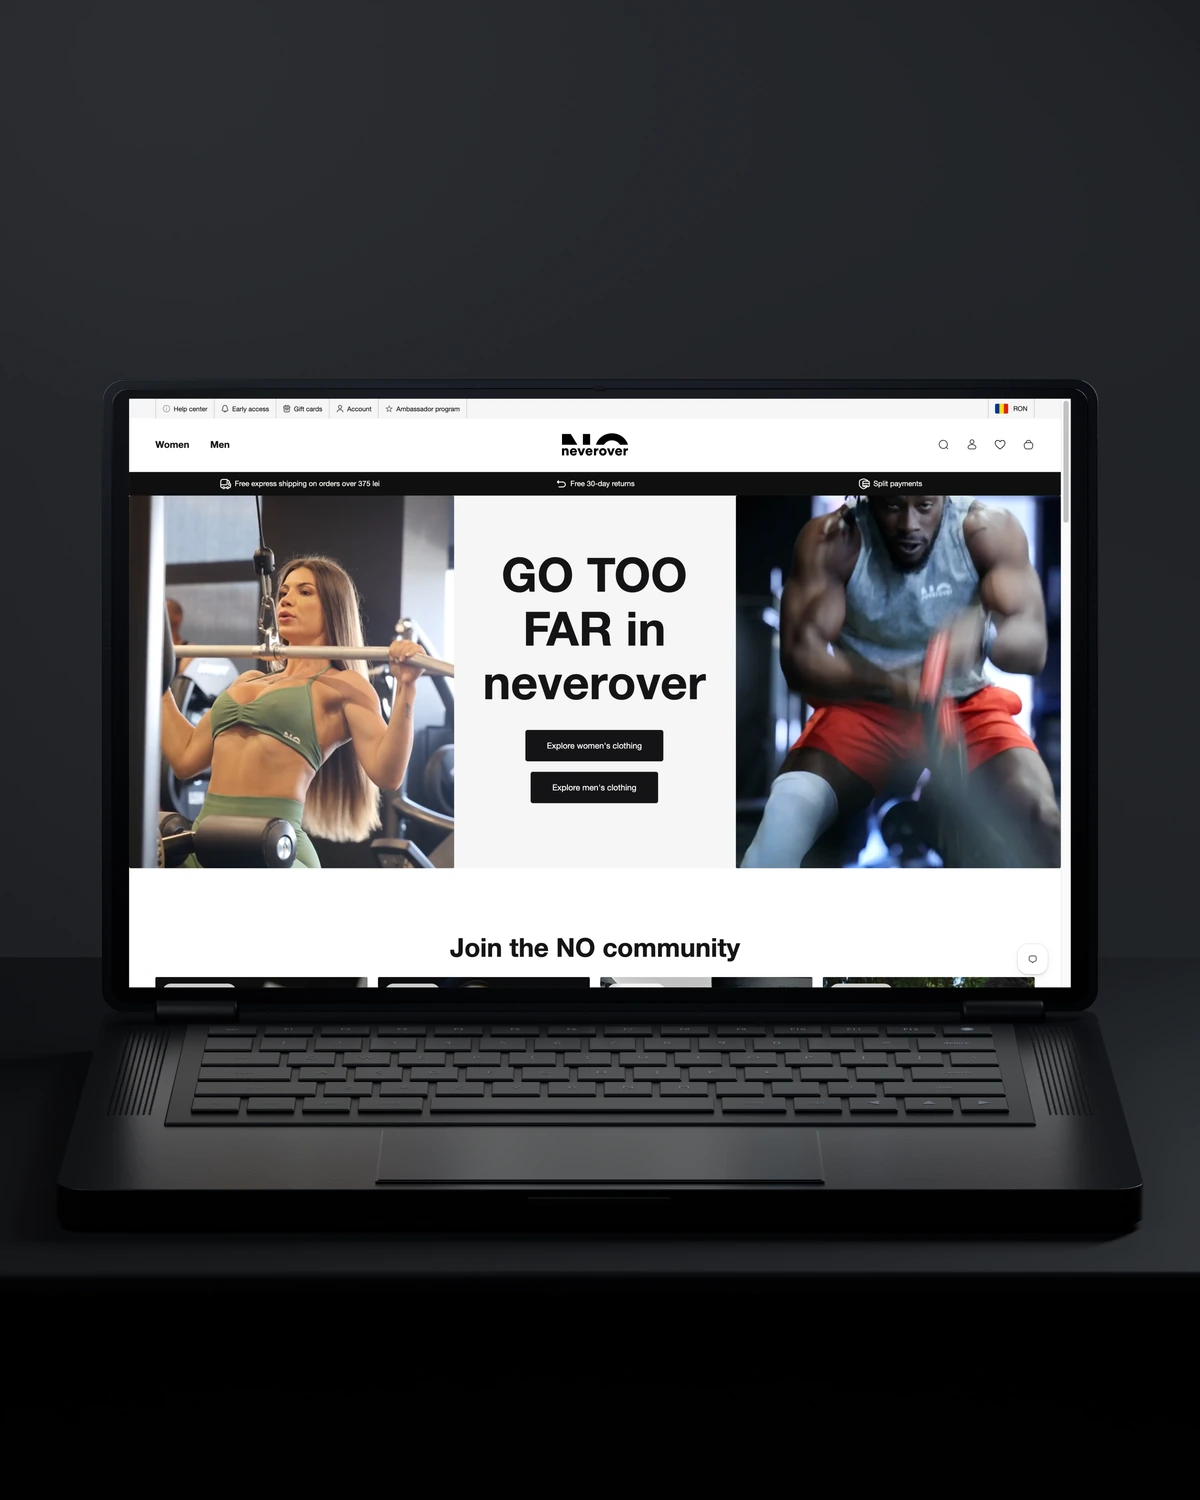
 Built to driveMore returning customers.
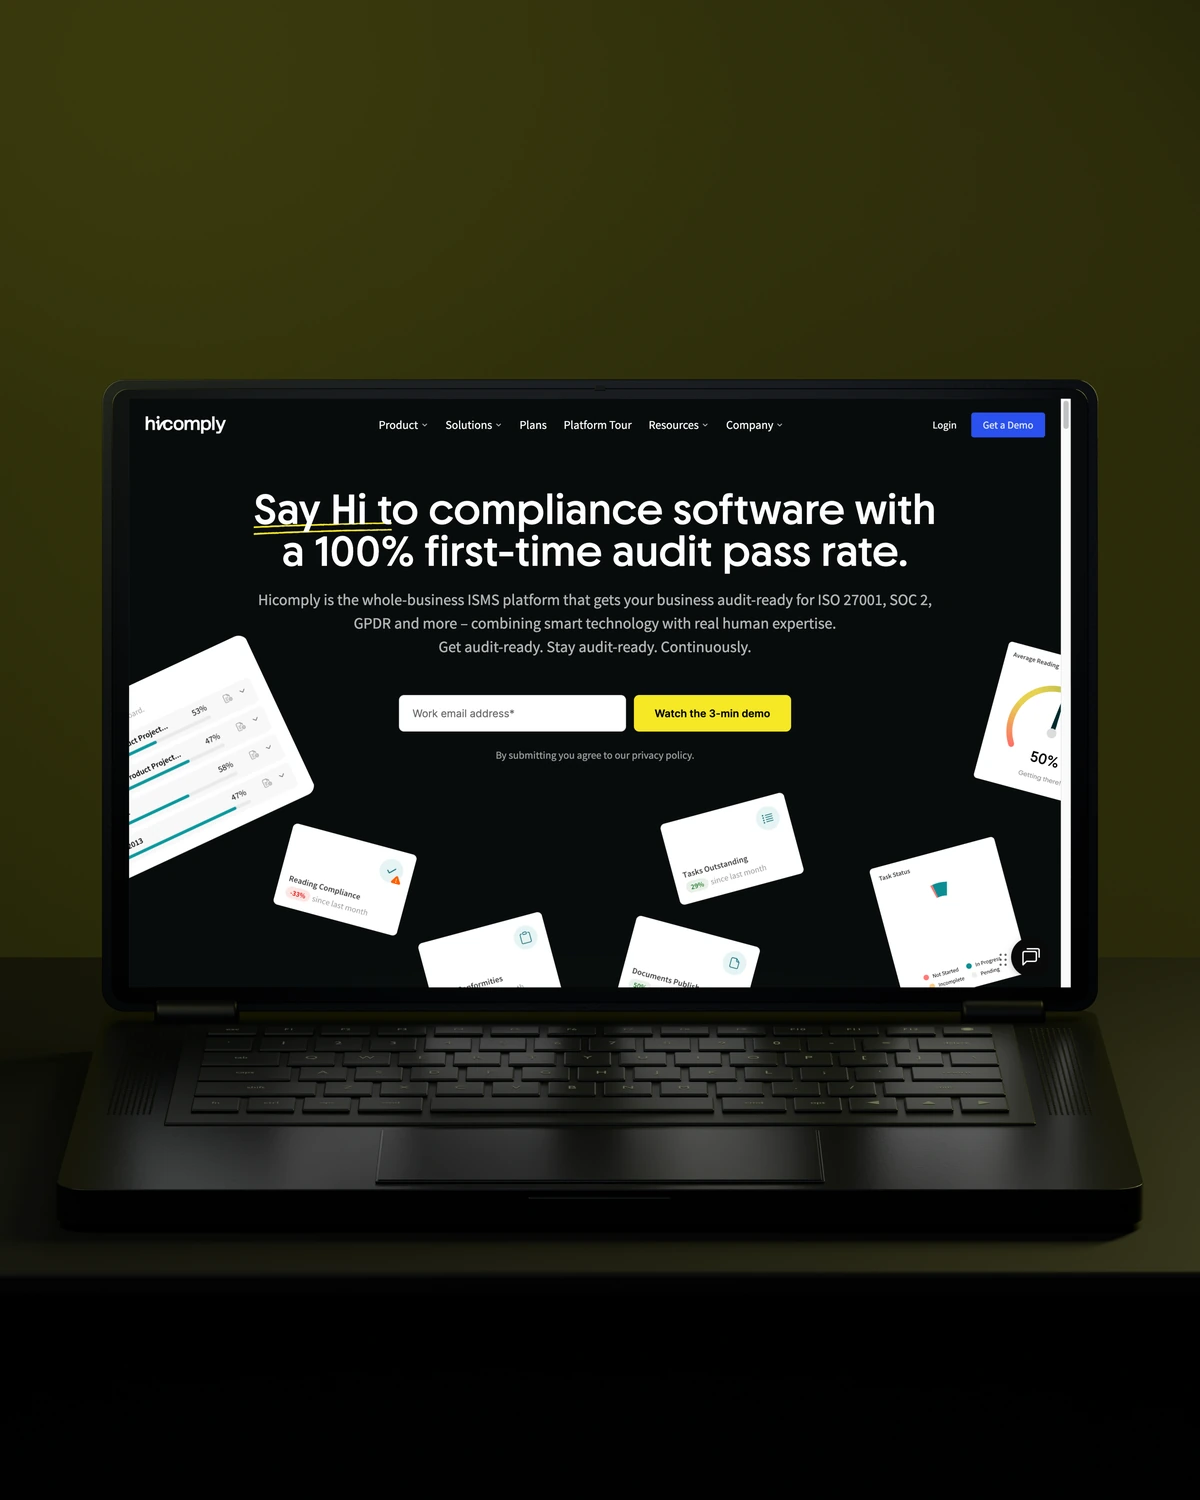
 Built to driveMore meaningful demos.
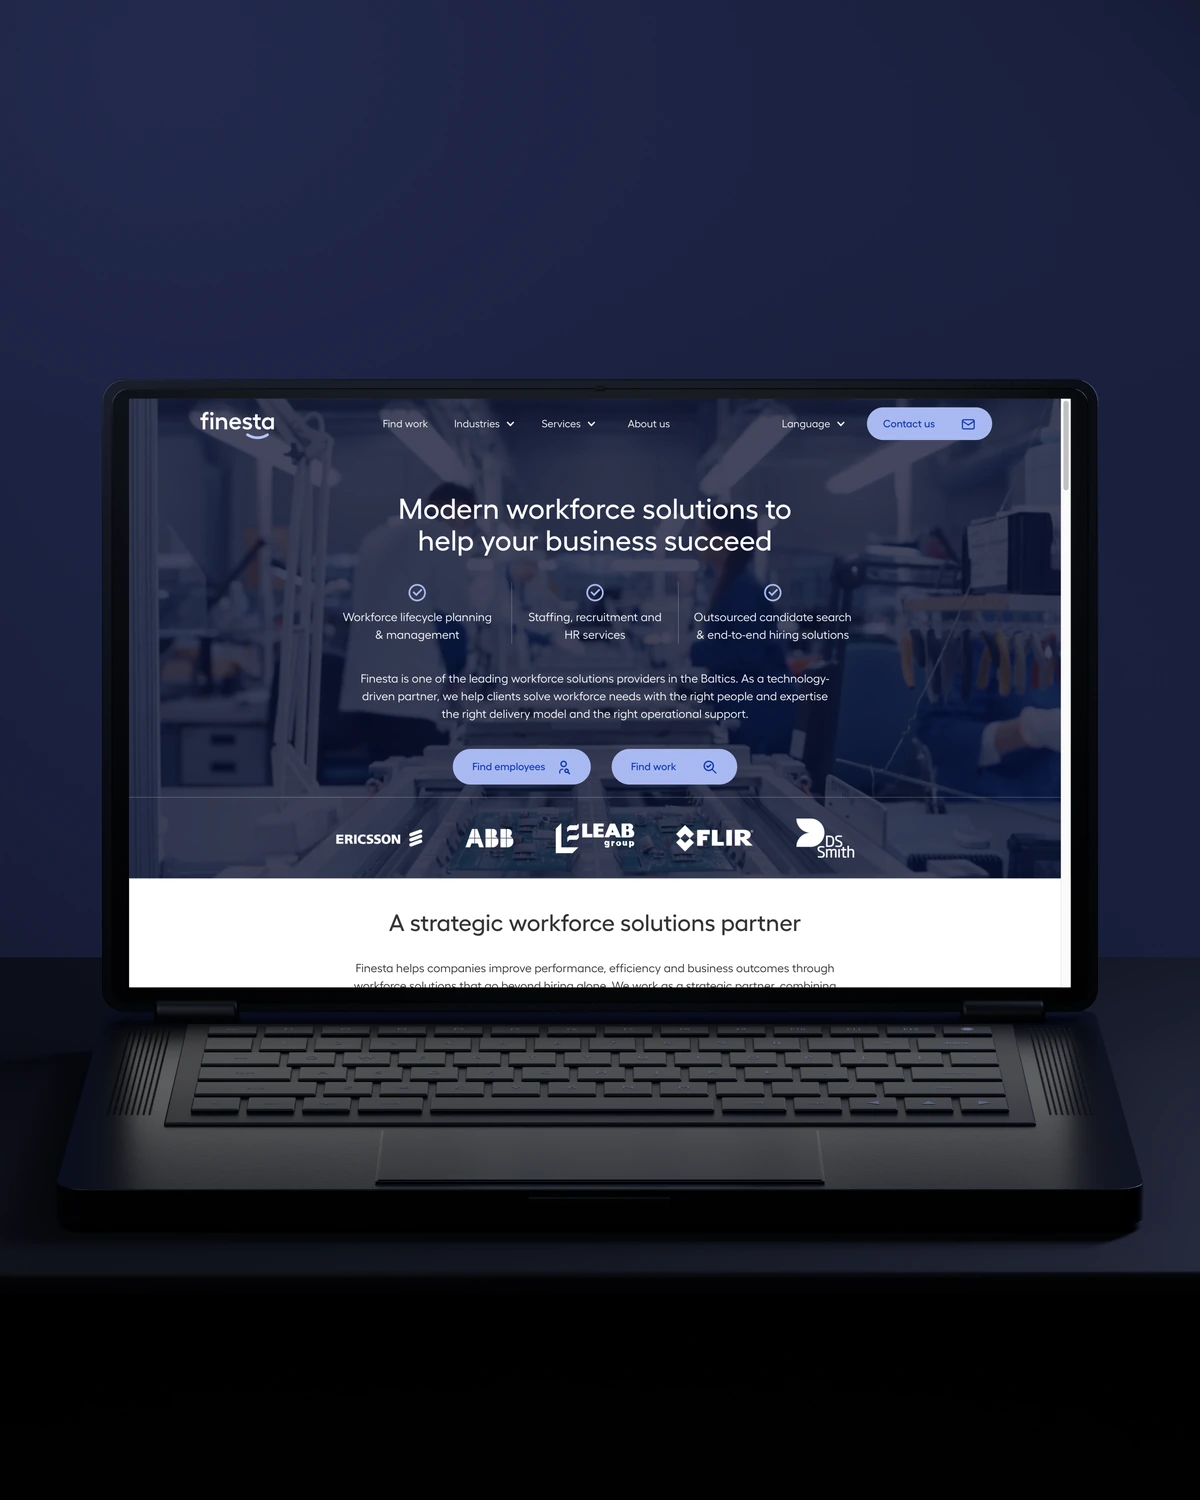
 Built to driveBetter talent connections.

 Built to driveMore course creators.
 Built to driveMore product discovery.
Trusted across our practice
Independent reviews. Long-term working relationships.


“We’ve been working with Stega & Gabriel for the last two years. Cannot recommend them enough. They’re responsive, professional & an asset.”
“Stega Creative team not only understood our needs and vision for the websites, but they also came up with improvements.”
“After a website (re)launch, they are also always accessible and happy to help. I highly recommend everyone who is looking for a new and more stable website in Webflow, to work with Stega!”
A few things worth discussing before your Databricks analytics takes shape.
Databricks can replace a BI tool for many teams through AI/BI dashboards and Genie, which answers questions in plain language. Teams with complex reporting or wide self-service needs often keep Tableau, Power BI or Looker on top of Databricks SQL. We build datasets that work with either choice.
Gold tables in Databricks are the final, business-ready layer of the medallion architecture, built from cleaned silver data. Gold tables hold aggregated metrics and reporting-ready rows shaped for specific dashboards or teams. We keep them small, documented and tied to one definition per metric.
Databricks reports match the CRM when both use the same definitions and the data is reconciled at build time. We compare totals for each metric against the CRM and billing system, trace every difference to a cause and document accepted gaps, such as deleted records or timing.
Agreeing metric definitions with your teams is often the slowest part. Once definitions are settled, datasets and dashboards follow quickly.
way.Your ambition. Our collective craft.
Strategy, design and technology, working as one.